Analytical controls
Analytical controls are found under Controls & Indicators › Control library, Analytical Review nature. The analytical review itself opens from the page of a DPM reporting.
An analytical control describes the breakdown of a template: which rows and columns are totals, and which rows and columns detail them. It is used for the analytical review of DPM reportings, which tracks how stable these breakdowns stay from one quarter to the next.
Analytical controls are shared by the whole organisation. Only the organisation administrator can create, edit and delete them.
The analytical control list
The Analytical Review nature of the control library opens the Analytical controls page. For each control, it lists its reference, template, description and its Valid from and Valid to bounds. The Search field filters the list on the reference, template or description.
The header offers Refresh, Integrate MLA Analytical Controls and New analytical control. A control’s ⋯ menu offers View, Edit and Delete.
Integrate MLA Analytical Controls
The Integrate MLA Analytical Controls button adds the catalogue of FINREP analytical controls designed by MLA: 24 controls, with AR-FIN-… references, valid from taxonomy 4.2.
- If none of their references exist yet, a confirmation asks “Add the N analytical controls designed by MLA?”.
- If some references already exist, a dialog lists them. Each one is marked “differs from the MLA version” or “same as the MLA version”.
- Tick the controls to override with the MLA version, or Override all. The others stay as they are.
- Click Integrate (N new, M overridden).
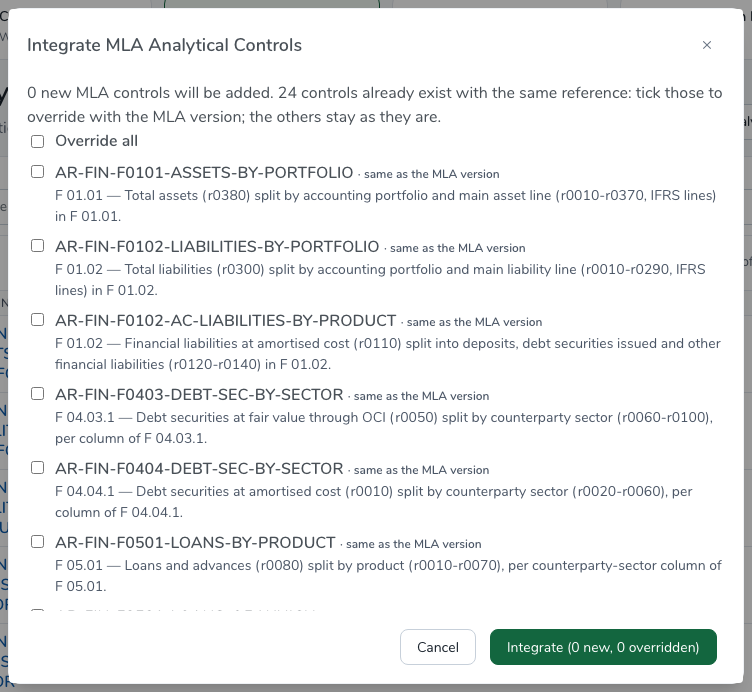
A message then gives the number of controls added, overridden and kept as they were. Integrating again changes nothing for controls that are already up to date. This action is open to every user.
Create or edit an analytical control
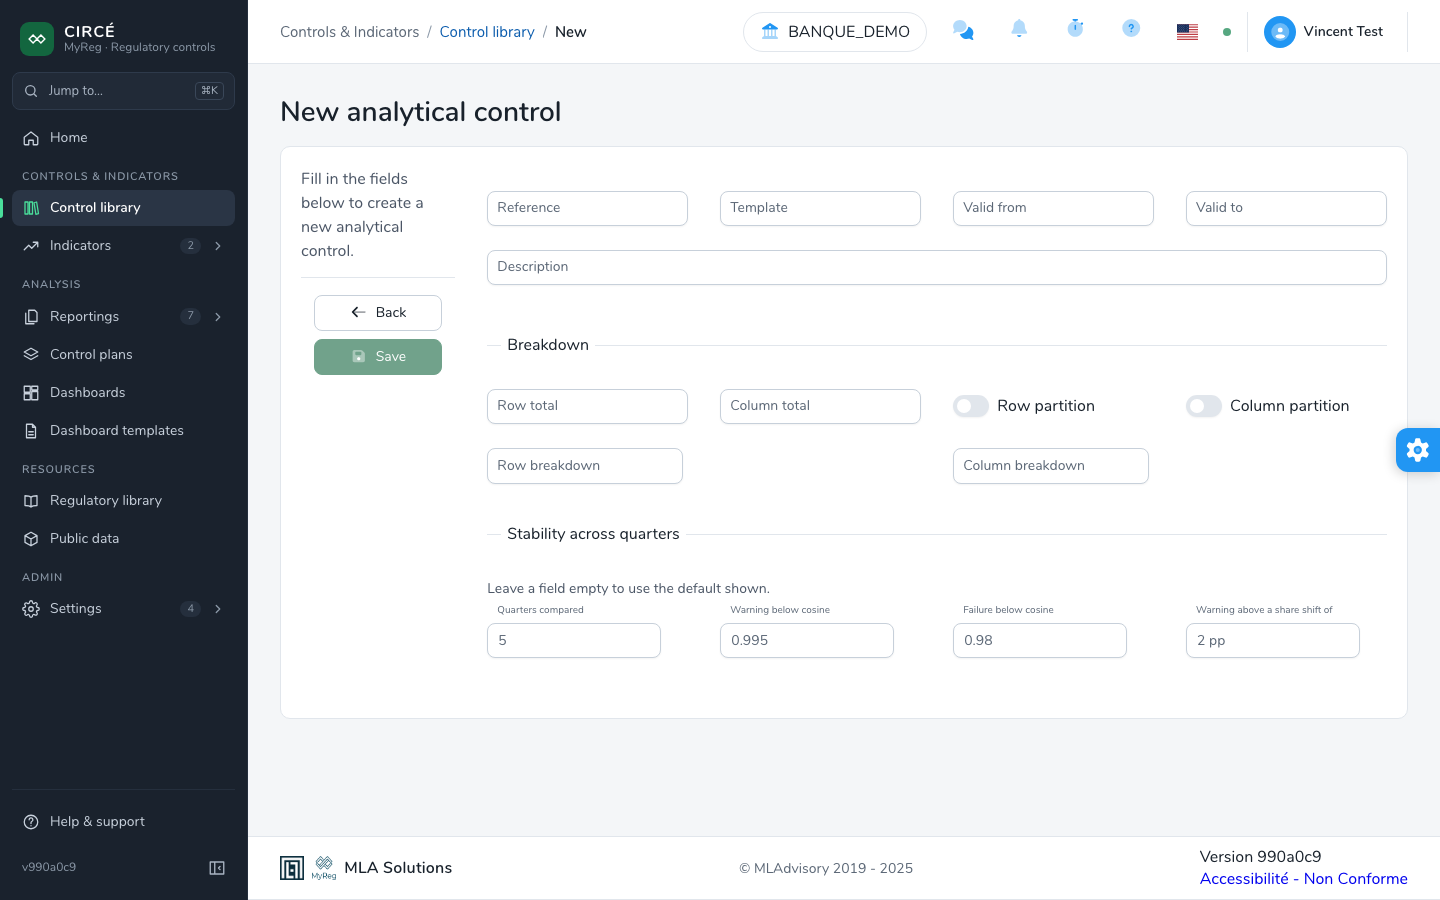
On the Analytical controls page, click New analytical control, or use Edit in a control’s ⋯ menu. Fill in the following fields:
| Field | Rule |
|---|---|
| Reference | Required and unique. |
| Template | Required: the template code, for example F 18.02.a. |
| Description | Required. |
| Valid from | The taxonomy release from which the control applies, for example 4.2. |
| Valid to | Optional: the last release to which the control applies. |
| Breakdown | Row total and Column total, then the Row breakdown and Column breakdown (comma-separated numbers), and the Row partition and Column partition options. |
| Stability across quarters | Optional. See below. |
A control only applies to reportings whose taxonomy release lies between Valid from and Valid to. Releases are compared numerically, part by part: 4.2 < 4.2.1 < 4.10. A blank bound is open. A file with no known release, for example an Excel file, is never excluded.
The Stability across quarters section sets the analytical review thresholds for this control. Leave a field empty to use the default shown.
| Field | Default | Rule |
|---|---|---|
| Quarters compared | 5 | From 2 to 12. |
| Warning below cosine | 0.995 | Between 0 and 1. |
| Failure below cosine | 0.98 | Between 0 and 1, and lower than the warning cosine. |
| Warning above a share shift of | 2 pp | In percentage points, from 0 to 100. |
The analytical review
The analytical review compares a processed DPM reporting with its previous quarters, analytical control by analytical control. To open it, click Open analytical review among the actions at the top of a DPM reporting’s page. The Back to file link returns to the reporting.
The quarters compared. At the top of the page, one chip per quarter shows:
- the reviewed file, which is always compared;
- for each previous quarter, the file used. Click the chip to exclude that quarter from the comparison, or to bring it back.
The previous quarters are reportings of the same perimeter, processed, with the same module, consolidation and LEI, reported before the reviewed file. Only files you can read are kept. When a quarter has several files (v1, v2, resubmissions…), a list under its chip lets you choose the file compared. By default, this is the official file, otherwise the most recent one. The chip then shows “version chosen”.
The Window (quarters) list sets the number of quarters compared: 4, 5 or 8.

The controls. On the left, the analytical controls that apply to the file’s templates are grouped by template, with their status. The header shows the number of failures and warnings.
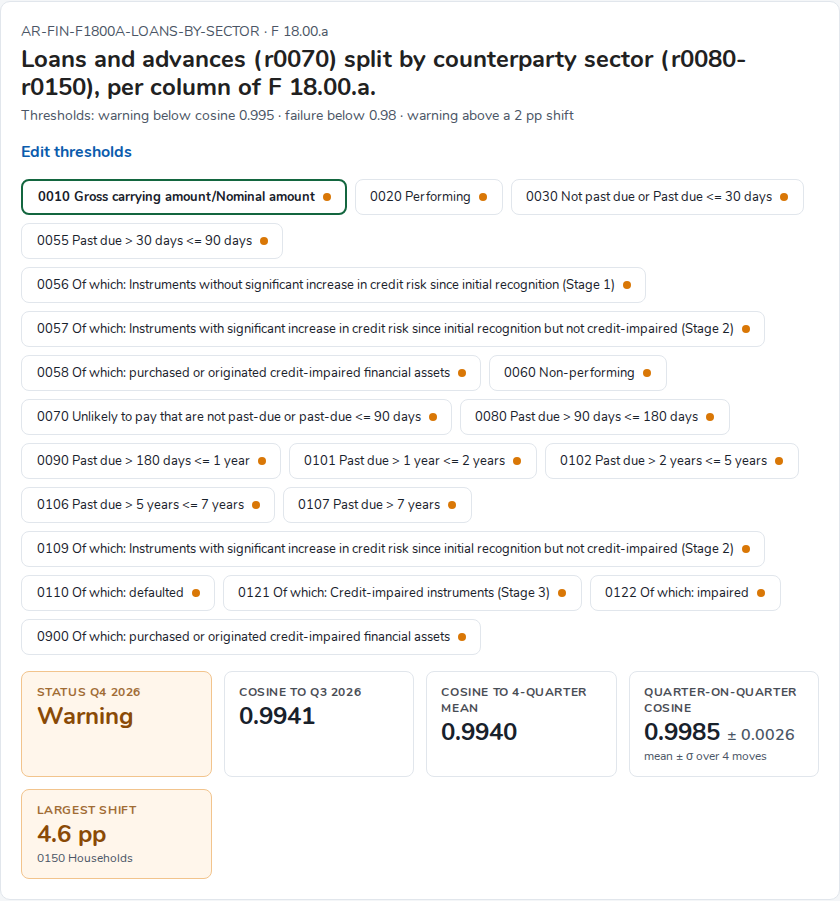
Stability. For the selected control, the page shows:
- the thresholds applied, and the Edit thresholds link to the analytical control;
- the choice of breakdown axis, when the control breaks down both rows and columns: By column · rows broken down or By row · columns broken down;
- one chip per column or row, in the colour of its status;
- tiles: the status of the reviewed quarter, the cosine to the previous quarter, the cosine to the mean of the previous quarters, the quarter-on-quarter cosine (mean ± σ) and the largest share shift, in points;
- the Shares table of each line, in % of the total, per quarter, with the mean, the standard deviation σ, the z-score of the reviewed quarter and the shift in points (Δ pp). Outliers are flagged;
- the Mix by quarter, as 100% bars;
- the Cosine to the previous quarter chart, with the warning threshold.
The status of a column or row is:
| Status | Rule |
|---|---|
| Failure | The cosine to the previous quarter, or the cosine to the mean, is below the failure cosine. |
| Warning | One of these two cosines is below the warning cosine, or the largest share shift exceeds the threshold in points. |
| OK | No threshold is crossed. |
| Not evaluated | Only one quarter is compared: stability needs at least one earlier declaration of the perimeter. |
The cosine sums up how similar two mixes are, but it is not very sensitive to small lines. This is why the share shift in points is always shown next to it.
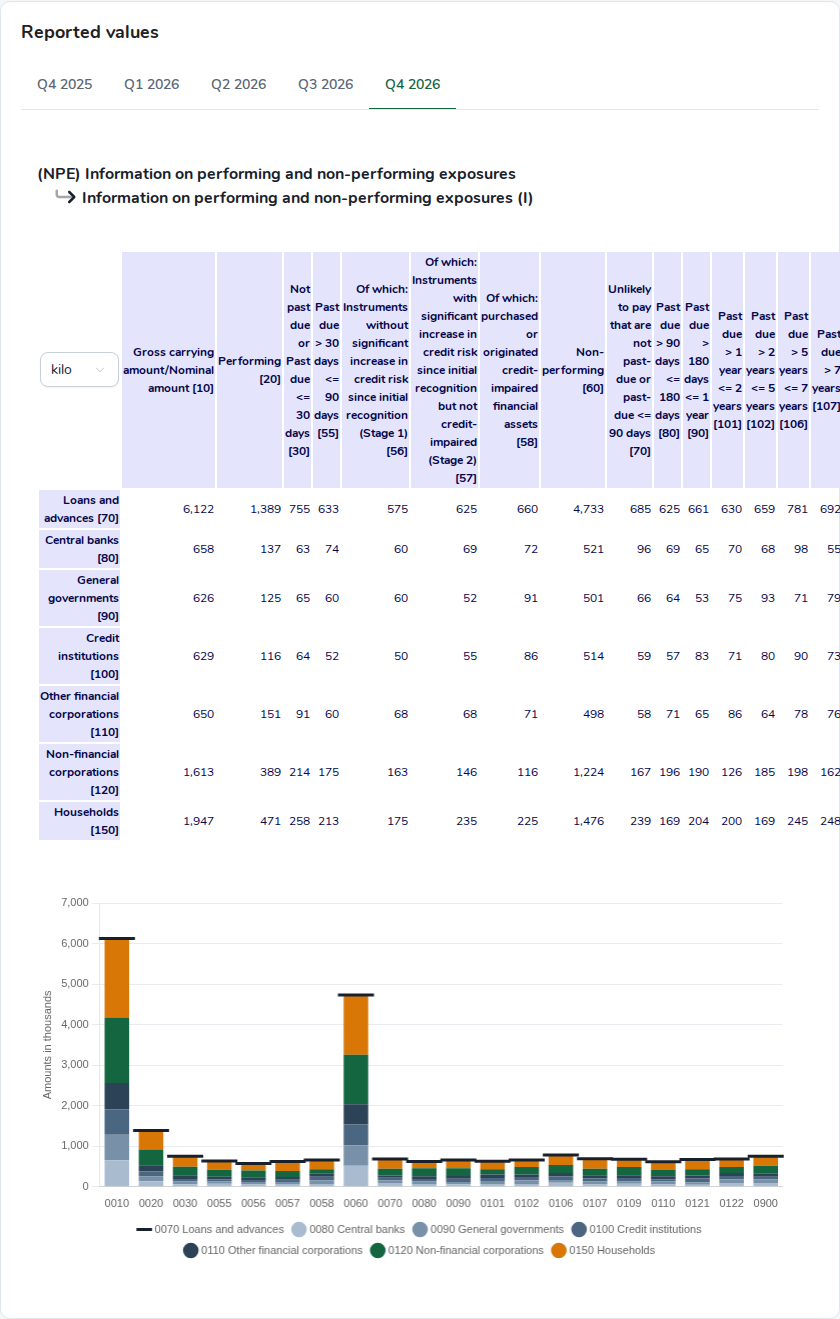
Reported values. The Reported values section has one tab per quarter, oldest first. Each tab shows the template table and a chart of the breakdown.
- The list at the top of the table chooses the unit:
unit,kilo(default),millionorbillion. The chart shows it in its axis title. - The chart stacks the breakdown lines and marks the total with a marker, without counting it twice.
The stability summary
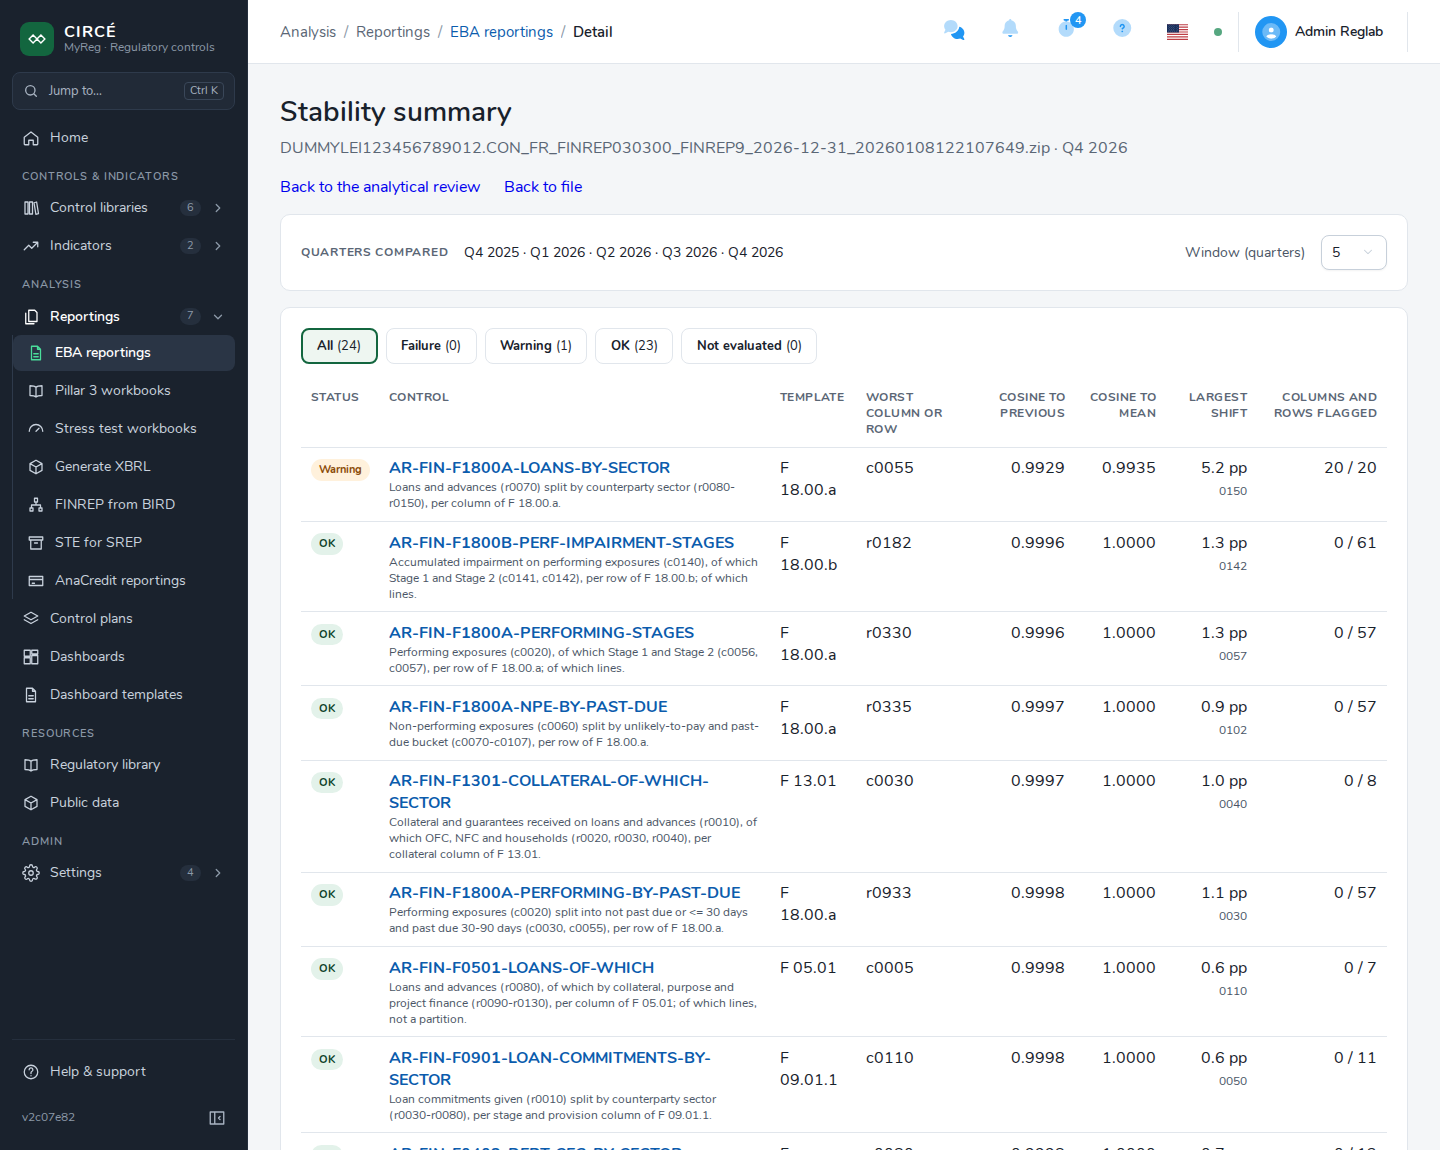
The Stability summary of the quarter link of the analytical review opens the Stability summary page. It lists all the file’s analytical controls, the most unstable first: failures, then warnings, then the lowest cosine.
- The All, Failure, Warning, OK and Not evaluated buttons filter the list and show the number of controls in each status.
- Each row shows the status, the control, the template, the worst column or row, the cosine to the previous quarter, the cosine to the mean, the largest shift and its line, and the number of columns and rows flagged.
- A control’s reference opens the analytical review on that control.
- The Window (quarters) list sets the number of quarters compared.
The Back to the analytical review and Back to file links return to the previous pages.