Indicators and dashboards
Indicators and dashboards sit in two sections of the menu:
- Controls & Indicators › Indicators:
- Custom indicators: your team’s indicators;
- EBA indicators: the EBA catalogue.
- Analysis:
- Dashboards: your dashboards and their runs;
- Dashboard templates: Excel workbooks filled with the values of your indicators, described on their own page.
Indicators
The indicator list
The Custom indicators page has the Import the EBA indicators, Import (.xlsx), Export all and New indicator actions in its header.
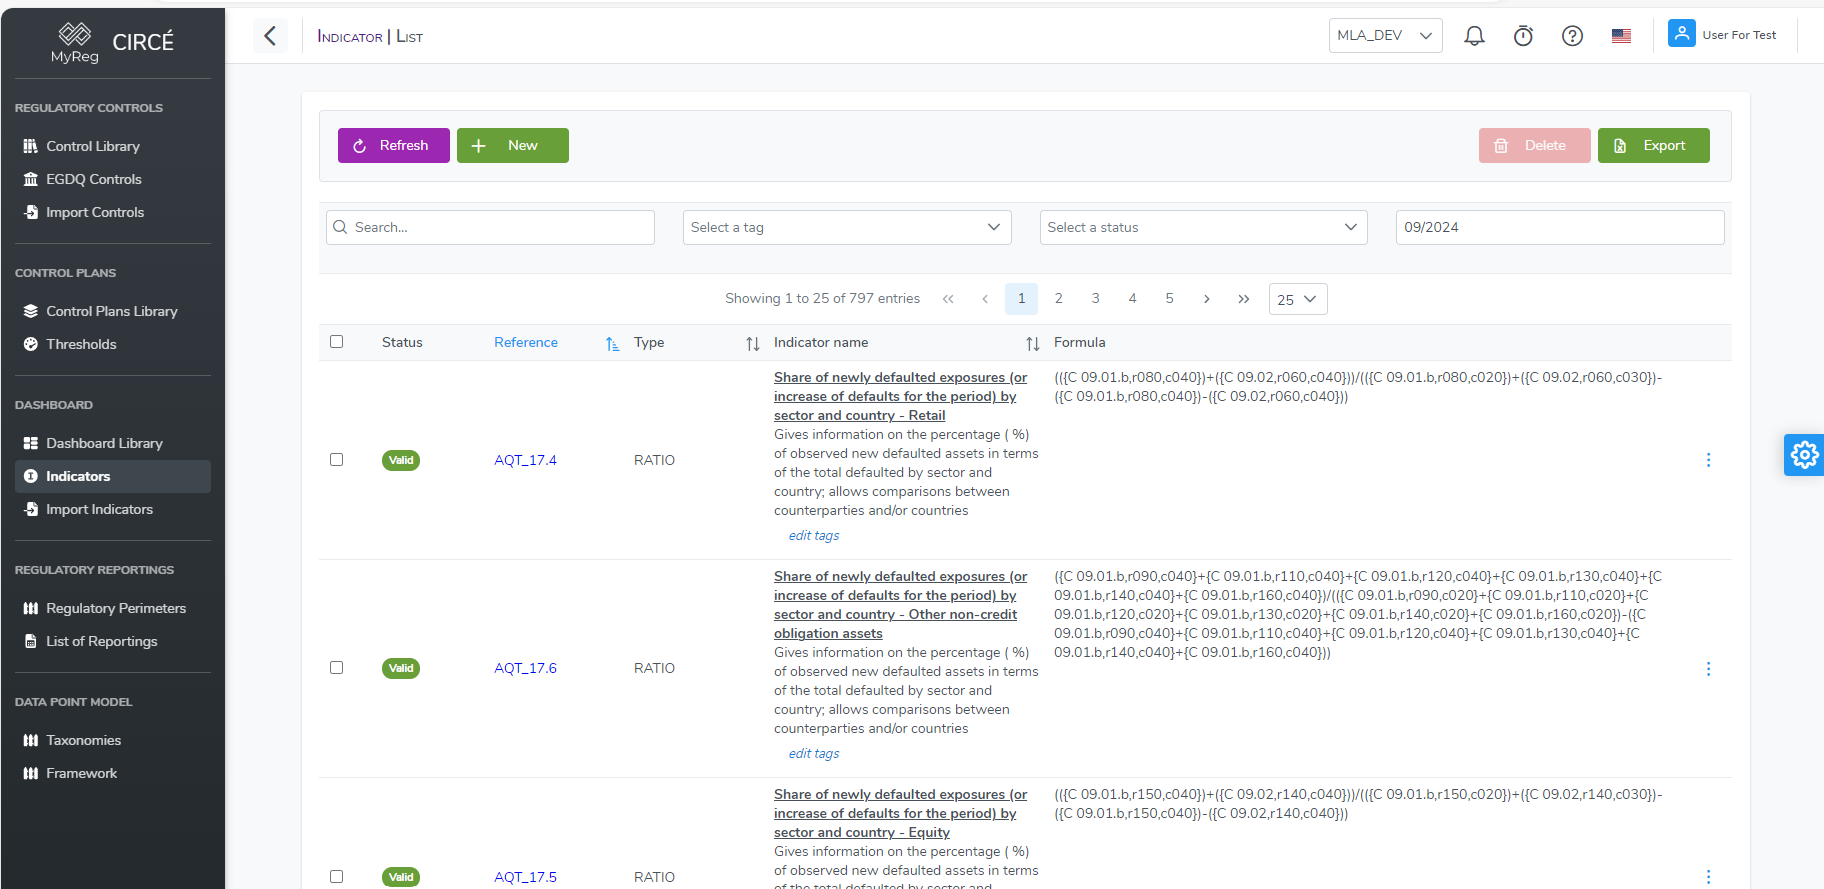
For each indicator, the list shows:
- its reference, which opens its detail page, and its name;
- its description and tags;
- the Show formula button. It expands the formula, one term per line, with the Copy and Edit indicator icons;
- its type, with the Cumulative mention where applicable;
- its validity status: Valid, Invalid, or an intermediate status such as Ambiguous or Incomplete.
The available filters are:
- Search: searches the reference, name, type, description and formula;
- Tags;
- Validity: All, Valid, Invalid, Not checked yet;
- Check validity for: the quarter for which statuses are displayed.
As for controls, missing statuses are computed in the background:
- The affected indicators show the Checking… badge.
- A “Checking validity against the … taxonomy: x of y” line shows the progress. You can keep working in the meantime.
- Exports are disabled while the computation runs.
Selection and bulk actions.
- Check indicators, or click Select all (n) to check all filtered indicators, across all pages.
- An action bar then appears: Add to dashboard…, Edit tags, Export selected, Permissions (if the Teams module is enabled), Delete… and Clear.
The ⋯ menu of a row offers Edit, Edit tags, Add to dashboard, Export, Permissions and Delete.
How to create a new indicator
On the list page, click New indicator.
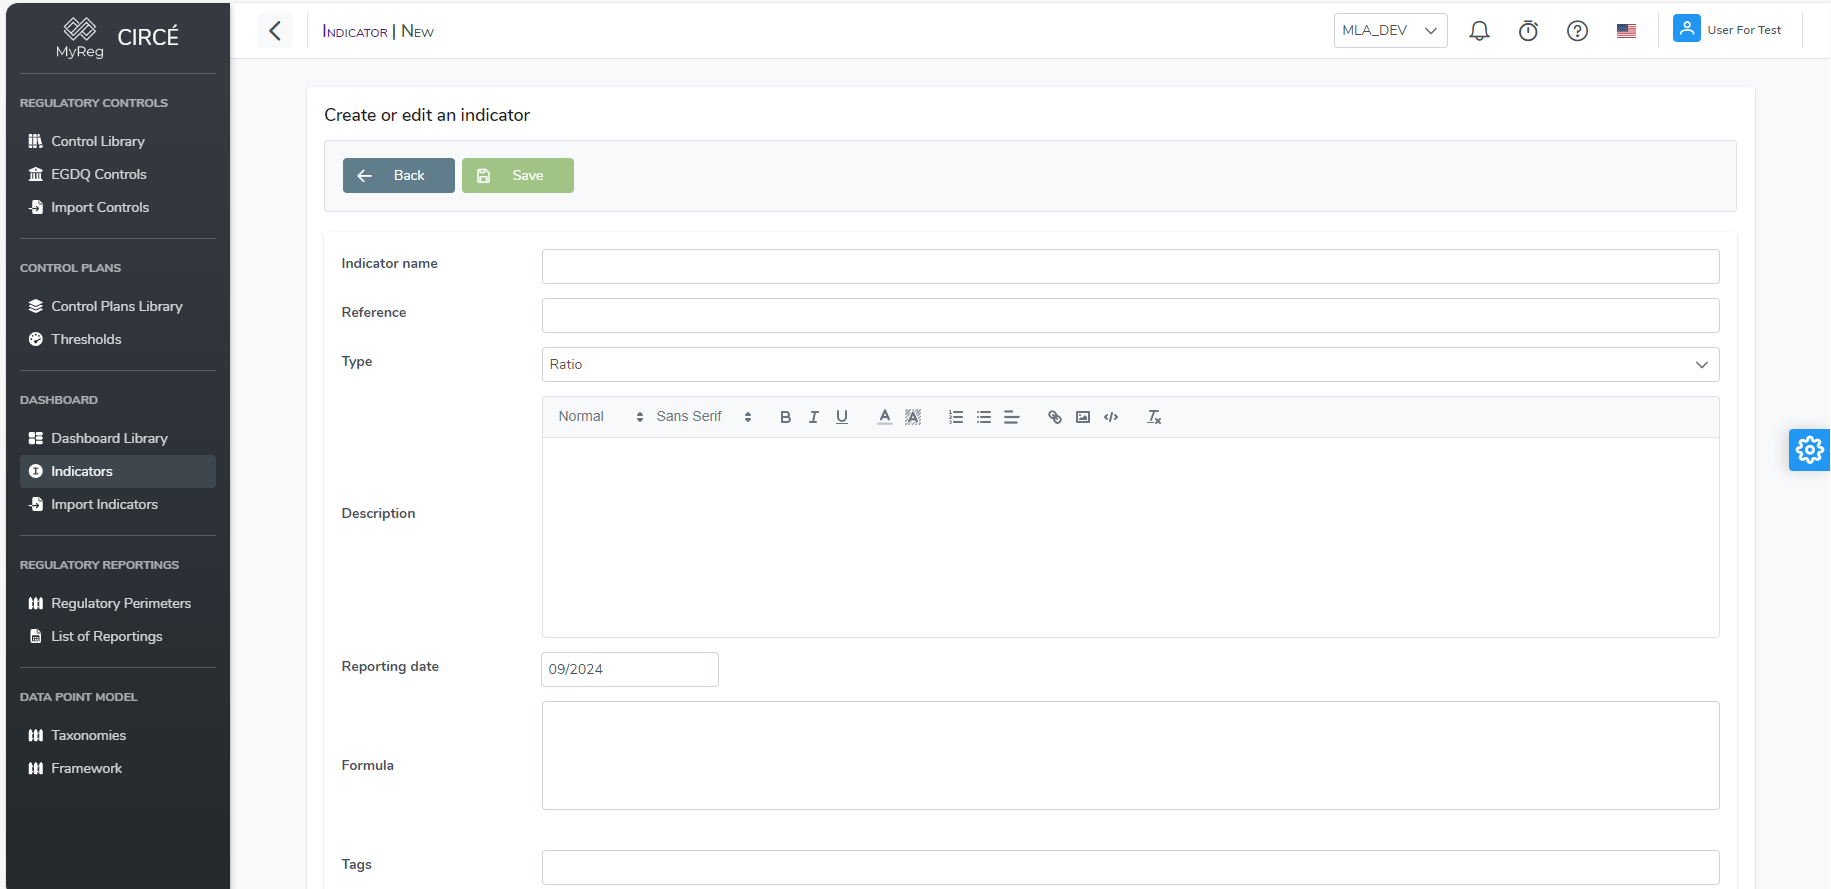
Fill in the following fields:
| Field | Rule |
|---|---|
| Reference | Required and unique. |
| Indicator name | Required. |
| Type | Required: Ratio (default) or Amount. |
| Description | Optional. |
| Formula | Required: a single member, with no comparison operator. See the grammar. |
| Tags | Optional. |
| Cumulative | Checked by default. It describes the nature of the indicator and has no effect on the calculation. |
| Reporting date | The date against which the formula is checked while you type. This field is not saved. |
A panel below the formula shows the result of the check. Click Save: the button is only enabled once all required fields are filled in. An incorrect formula does not prevent saving: the indicator then gets the Invalid status.
How to edit an indicator
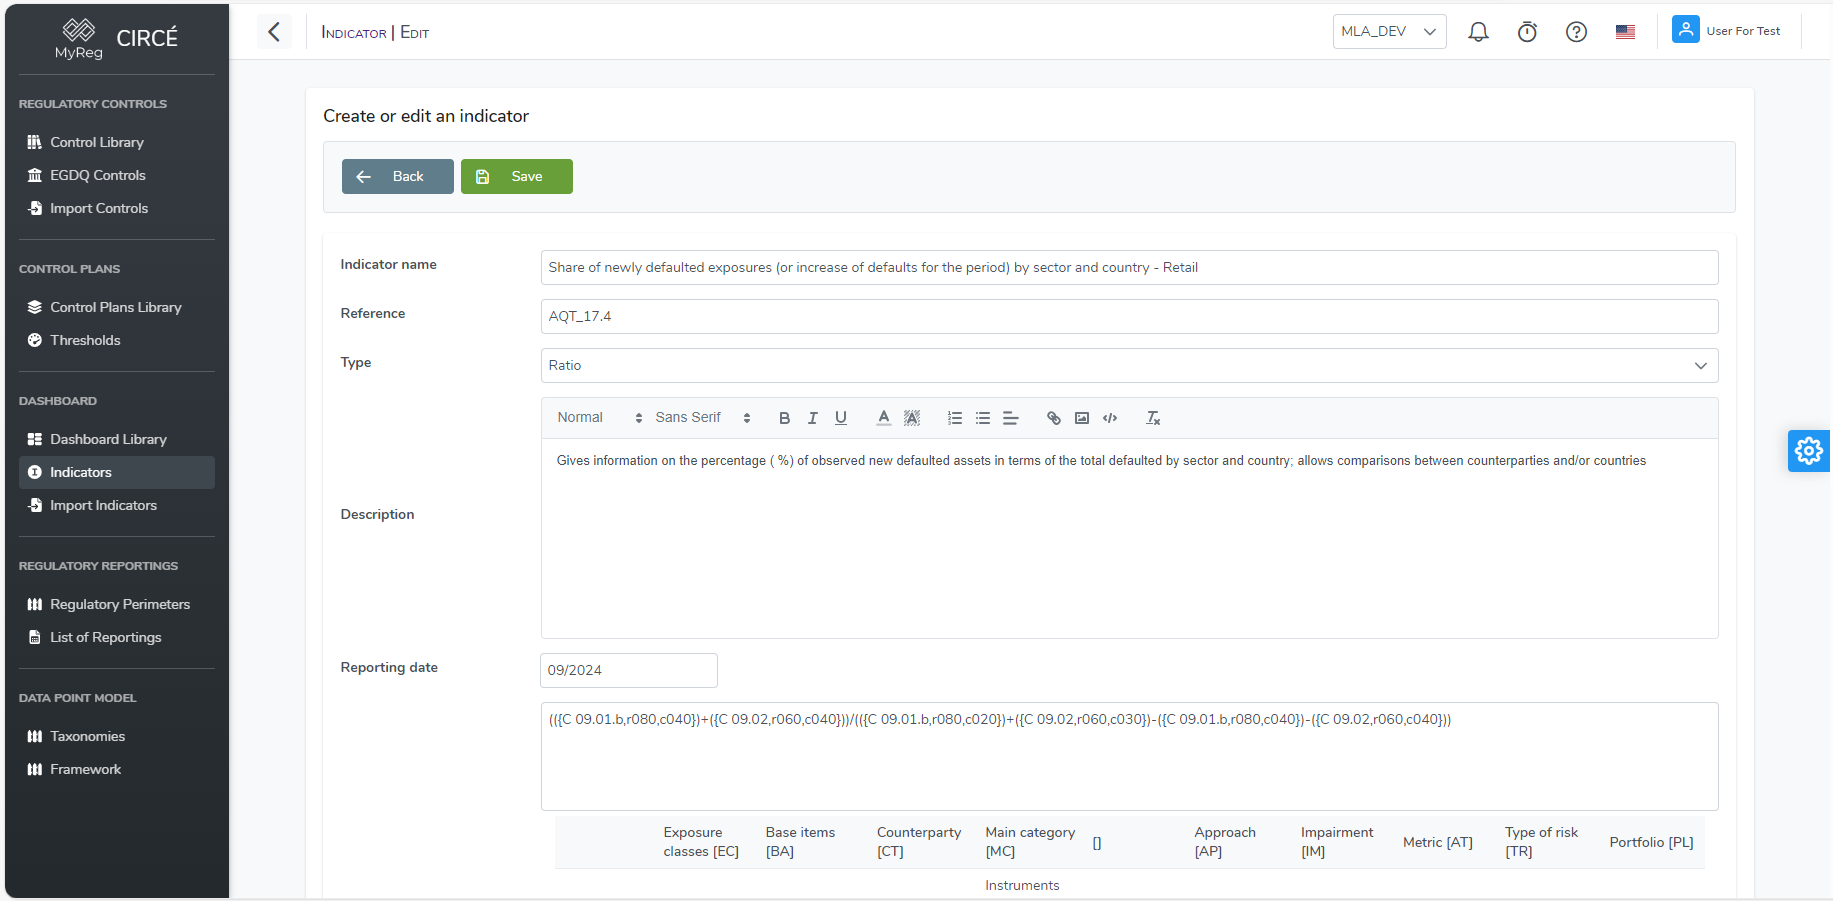
Open an indicator and click Edit. You can also use the Edit entry of the ⋯ menu on the list page, or the Edit indicator icon of the expanded formula.
Make your changes on the Edit indicator page, then click Save.
The detail page of an indicator also lists the dashboards that use it.
How to add indicators to a dashboard
From the indicator list:
- Check the indicators, then click Add to dashboard…. For a single indicator, use the Add to dashboard entry of its ⋯ menu.
- Pick the dashboard in the dialog, then click Add.
Indicators already in that dashboard stay as they are.
How to delete one or more indicators
On the list page, use the Delete entry of an indicator’s ⋯ menu. To delete several, check them, then click Delete… in the action bar.
The “Delete n indicator(s)?” confirmation lists the indicators concerned. It lets you confirm or cancel your action.
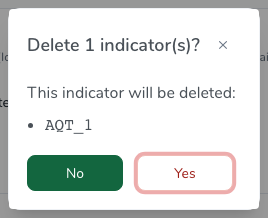
An indicator used in one or more dashboards cannot be deleted.
Remove it from those dashboards first. You do not need to delete the results that used it.
In a bulk deletion, indicators that are still in use are kept without any message.
How to export indicators to an Excel file
The list page offers three exports:
- Export all, in the header: exports the indicators matching the Tags, Validity and Check validity for filters. The Search filter is not applied.
- Export selected, in the action bar: exports only the checked indicators.
- Export, in the ⋯ menu of a row: exports only that indicator.
The buttons show a loading indicator until the file arrives.
The yyyy_MM_dd_HH_mm_ss_indicators.xlsx file contains the following columns:
- Reference, Type, Name, Formula, Description, Tags;
- Cumulative;
- the status;
- the dashboards that use the indicator.

This file can be re-imported as is.
How to import indicators
On the list page, click Import (.xlsx). The Import indicators page opens.
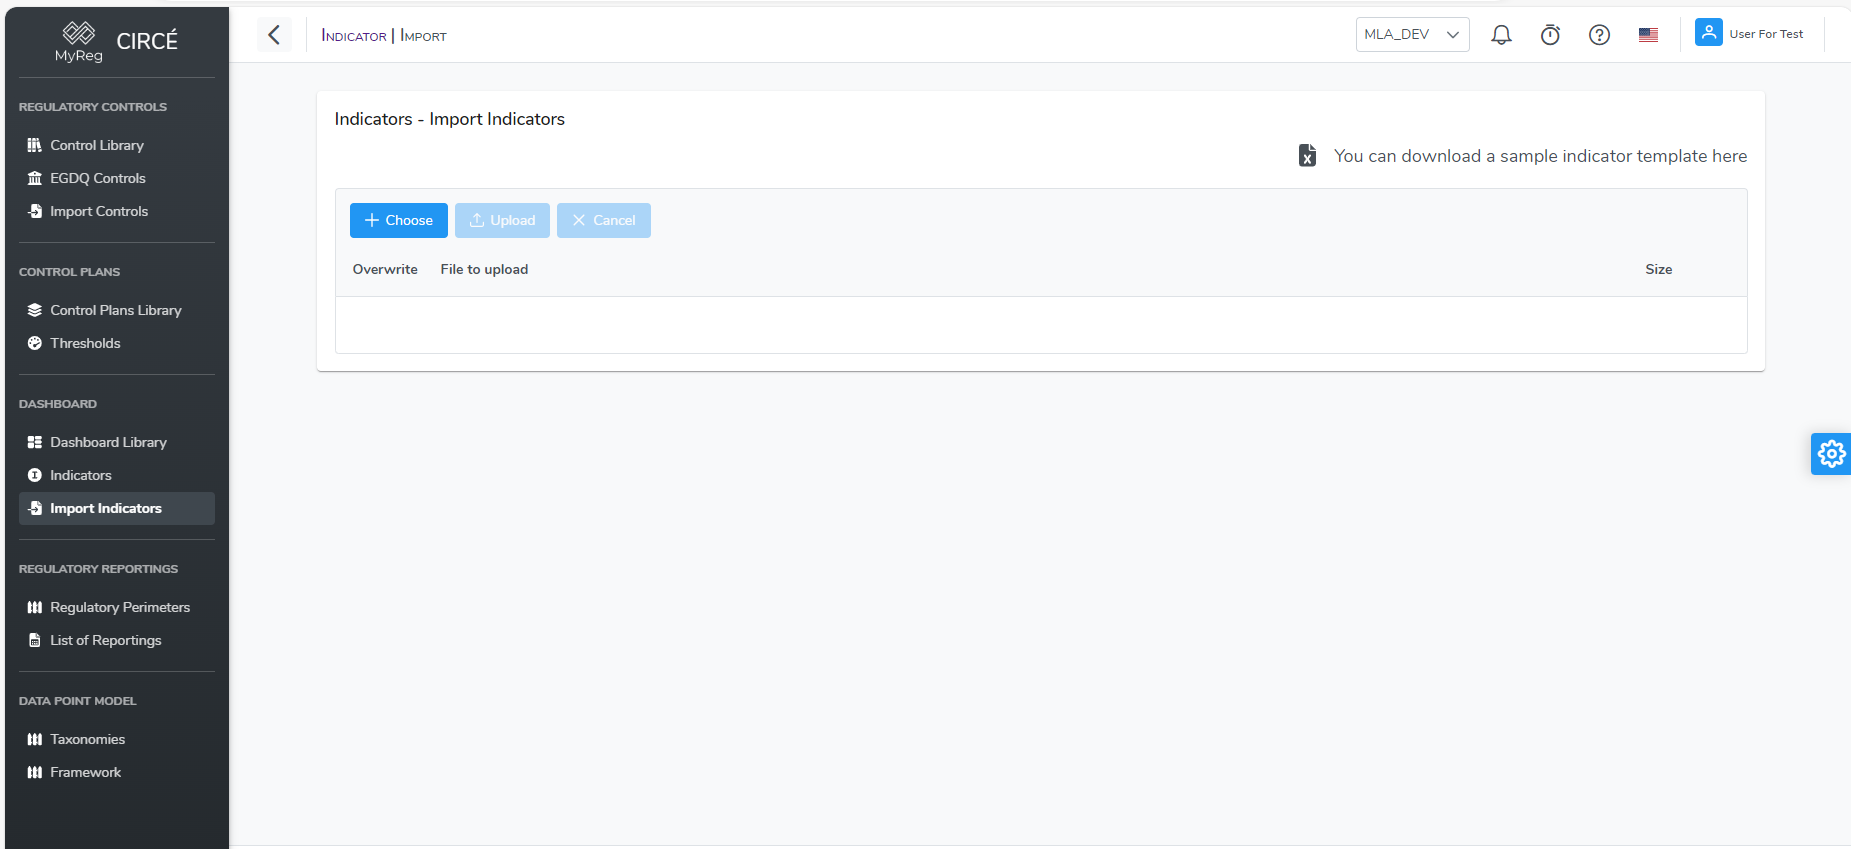
The “You can download a sample indicator template here” link provides the Excel template. You can also start from an exported file.

The first sheet of the file is read, with the following columns:
- required: Reference, Type (
RATIOorAMOUNT), Name and Formula; - optional: Description, Tags (comma-separated) and Cumulative (column H of the template). If Cumulative is missing, the indicator is not cumulative: an older template without this column is therefore still accepted.
If a required value is missing on a single row, or if a type is incorrect, the whole file is rejected with a message naming the column at fault.
To load the file:
- Click Choose and select the
.xlsor.xlsxfile. It is listed with its size. - If needed, check Overwrite on its row: indicators whose reference already exists are then updated. Otherwise, they are skipped.
- Click Upload.
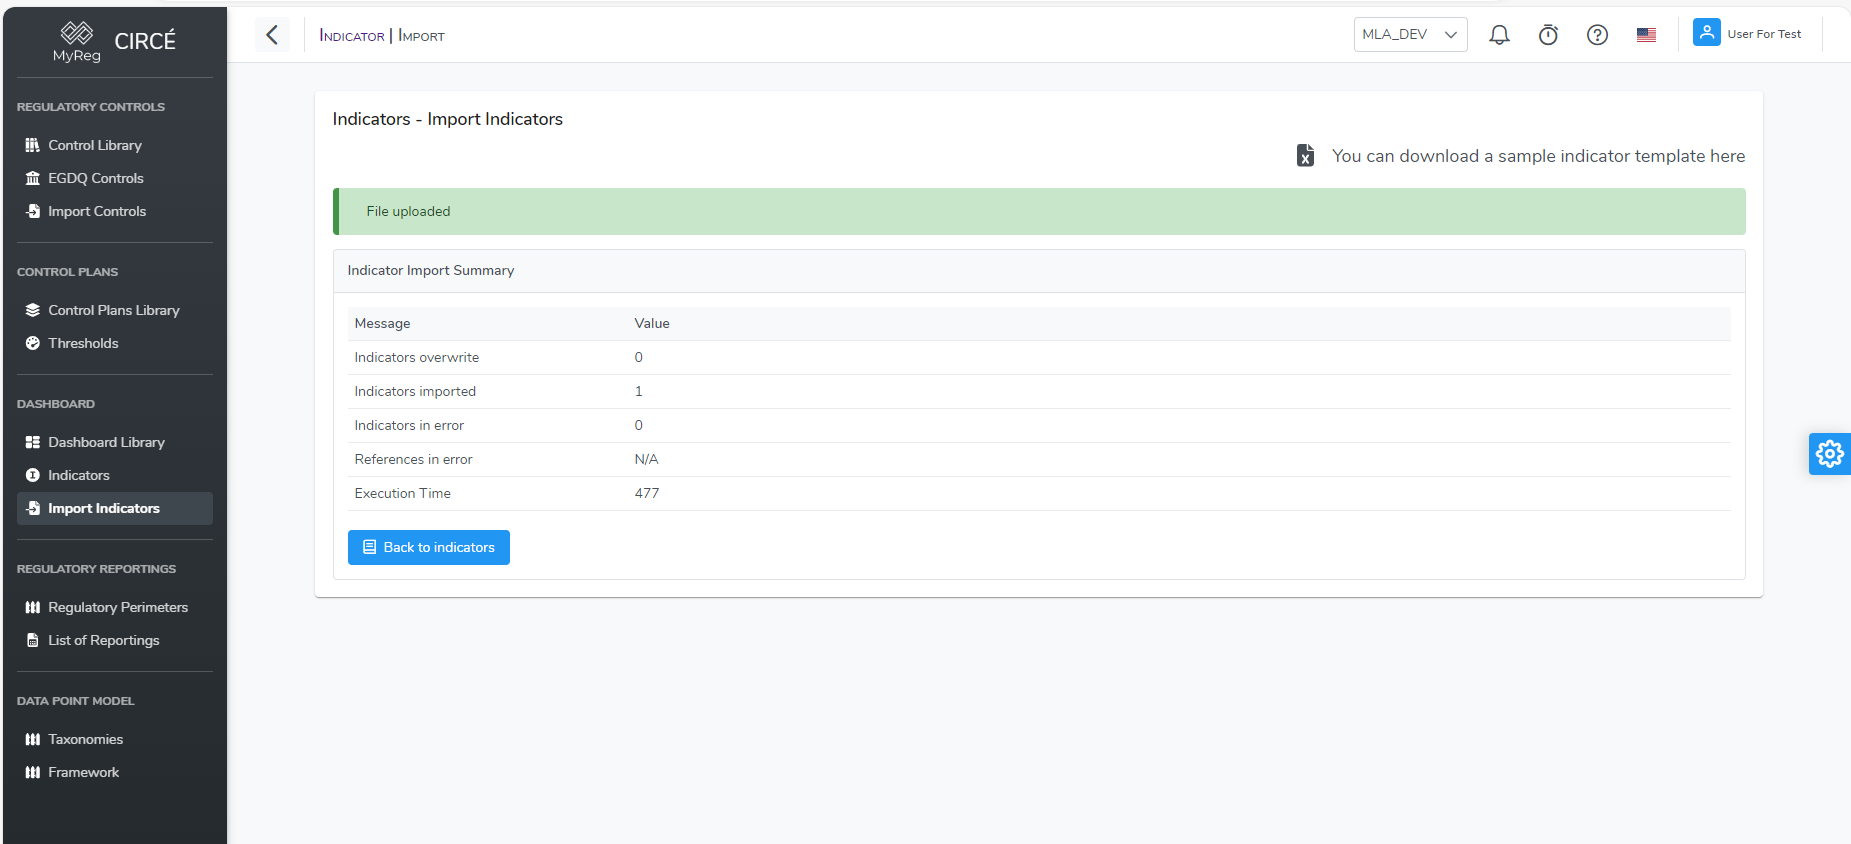
A summary then shows the indicators that were imported, skipped or overwritten, and those in error. The Back to indicators button returns to the list.
How to import the EBA indicators
CIRCÉ provides a ready-made list of EBA risk indicators: those of the EBA catalogue the application can compute. You can add it to your indicators without filling in an Excel file.
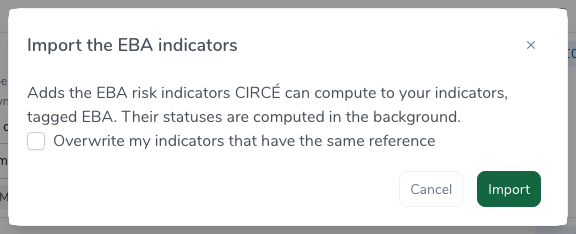
- Click Import the EBA indicators on the Custom indicators page, or Import into my indicators on the EBA indicators page.
- In the Import the EBA indicators dialog, check Overwrite my indicators that have the same reference if needed. The option is unchecked by default:
- unchecked, your existing indicators are kept, including formulas you corrected;
- checked, they are replaced by the EBA version.
- Click Import.
The dialog then shows the report: Indicators imported, Indicators already imported or Indicators overwritten, and Indicators in error.
- The imported indicators carry the
EBAtag. - Their validity statuses are computed in the background.
- Closing the dialog reloads the indicator list.
The import requires the same right as the Excel import.
The shipped list is regularly corrected and extended: for instance SME_4 and SME_5, which now compute a one-year growth, or the concentration and MiCA indicators that were added.
To get a new version, run the import again with Overwrite my indicators that have the same reference.
EBA indicators
The EBA indicators page presents the official EBA catalogue of risk indicators, read-only.
For each indicator, it shows:
- its reference;
- its category and frequency;
- its name and description;
- its formula, with the list of data points used;
- its value range.
The available filters are Search keyword, Templates (the templates used) and Category.
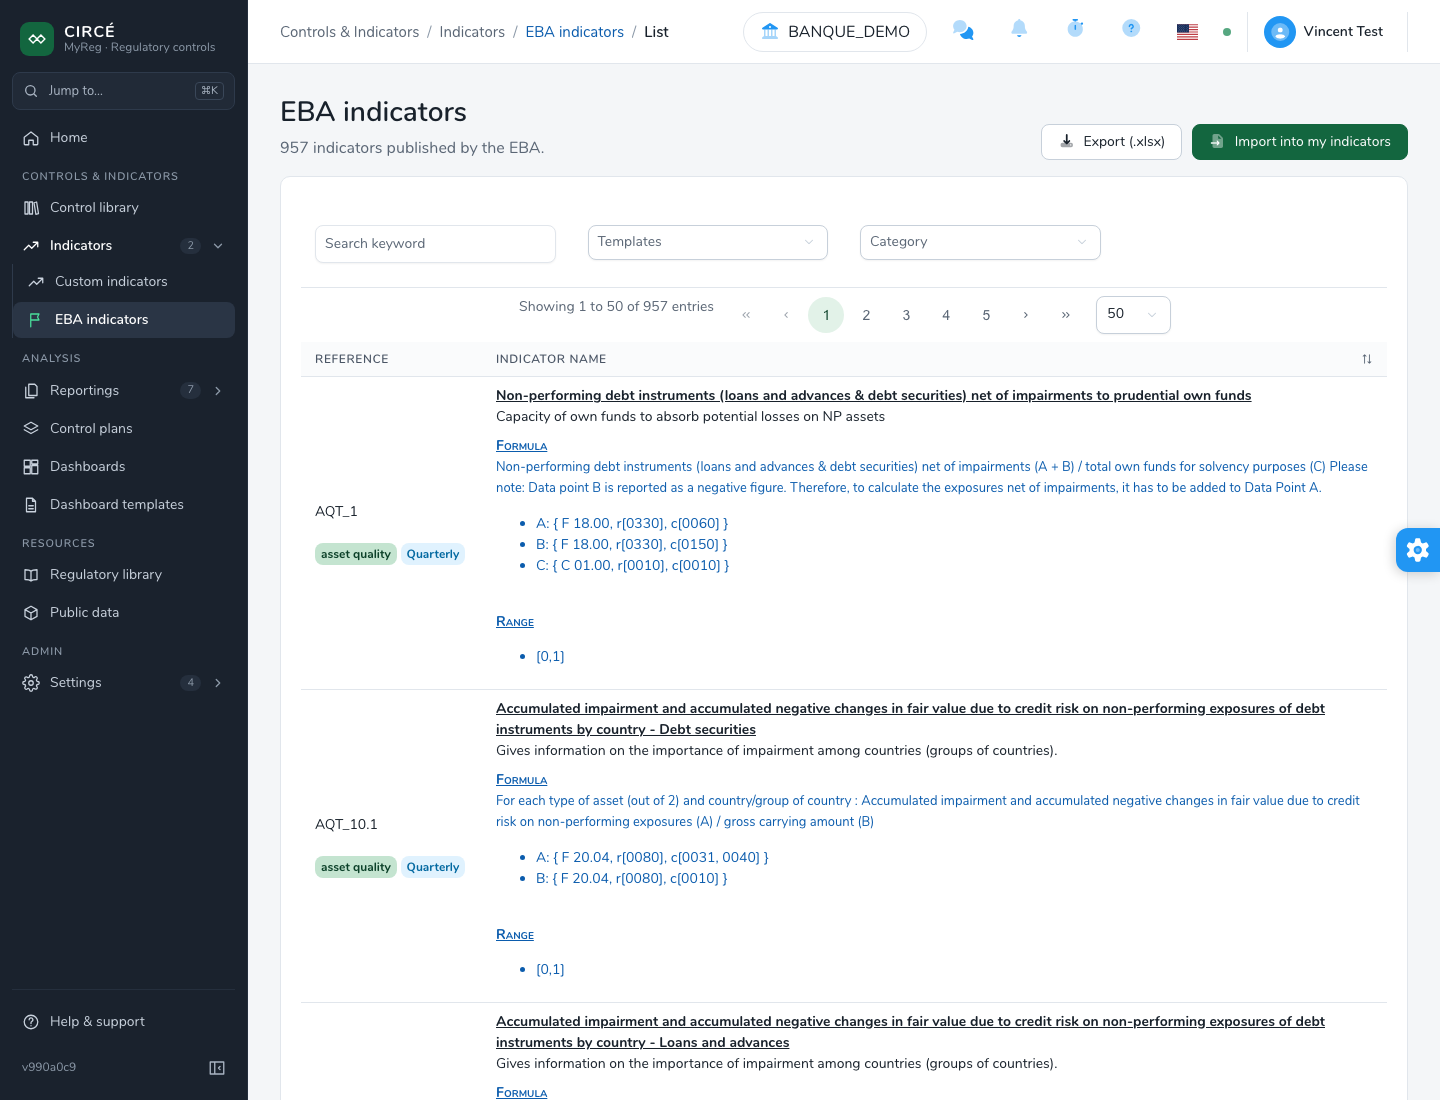
The header offers two actions:
- Import into my indicators: see How to import the EBA indicators.
- Export (.xlsx): downloads the full EBA workbook, in its current version, with one sheet per risk domain. This file is not in the indicator import format.
Dashboard
The dashboard list
The Analysis › Dashboards page has the Refresh, Import (.xlsx), Export (.xlsx) and New dashboard actions in its header.
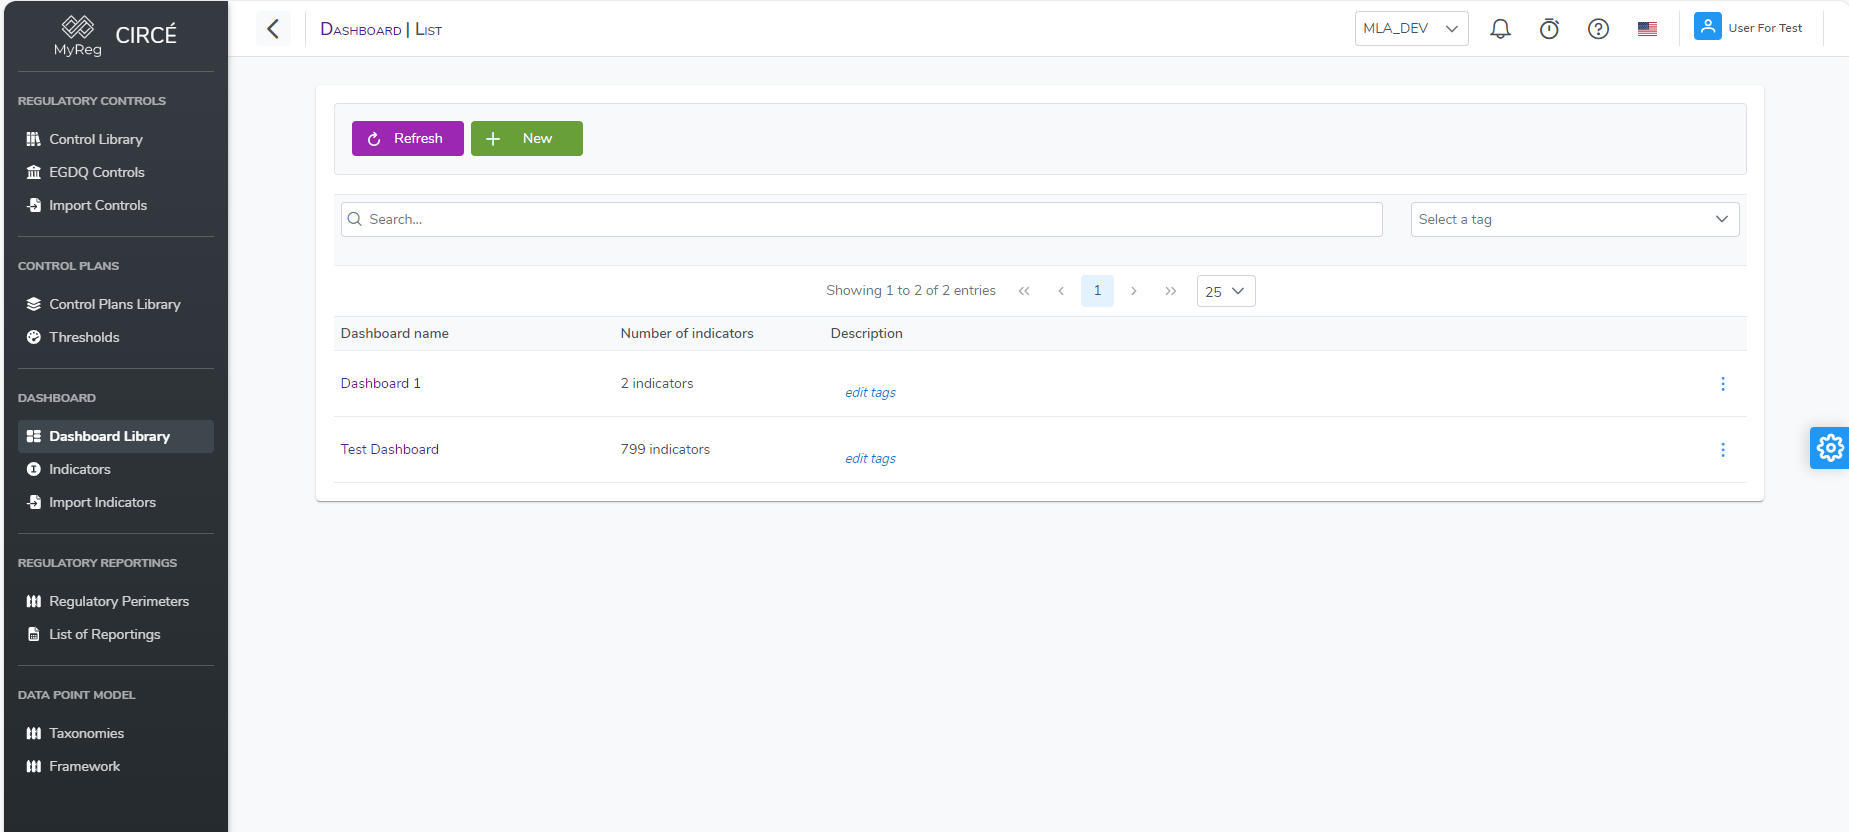
For each dashboard, the list shows:
- its name, which opens its page;
- its description;
- its Last run: the end date of its latest run;
- its number of Indicators.
You can sort the list by name, by last run or by number of indicators.
The filters are Search (“Name, description, tag…”) and Tags. Clear filters resets them.
Check dashboards to show the action bar: Export selected, Delete… and Clear.
The ⋯ menu of a row offers View, Edit, Delete and Permissions.
How to create a new dashboard
On the list page, click New dashboard.
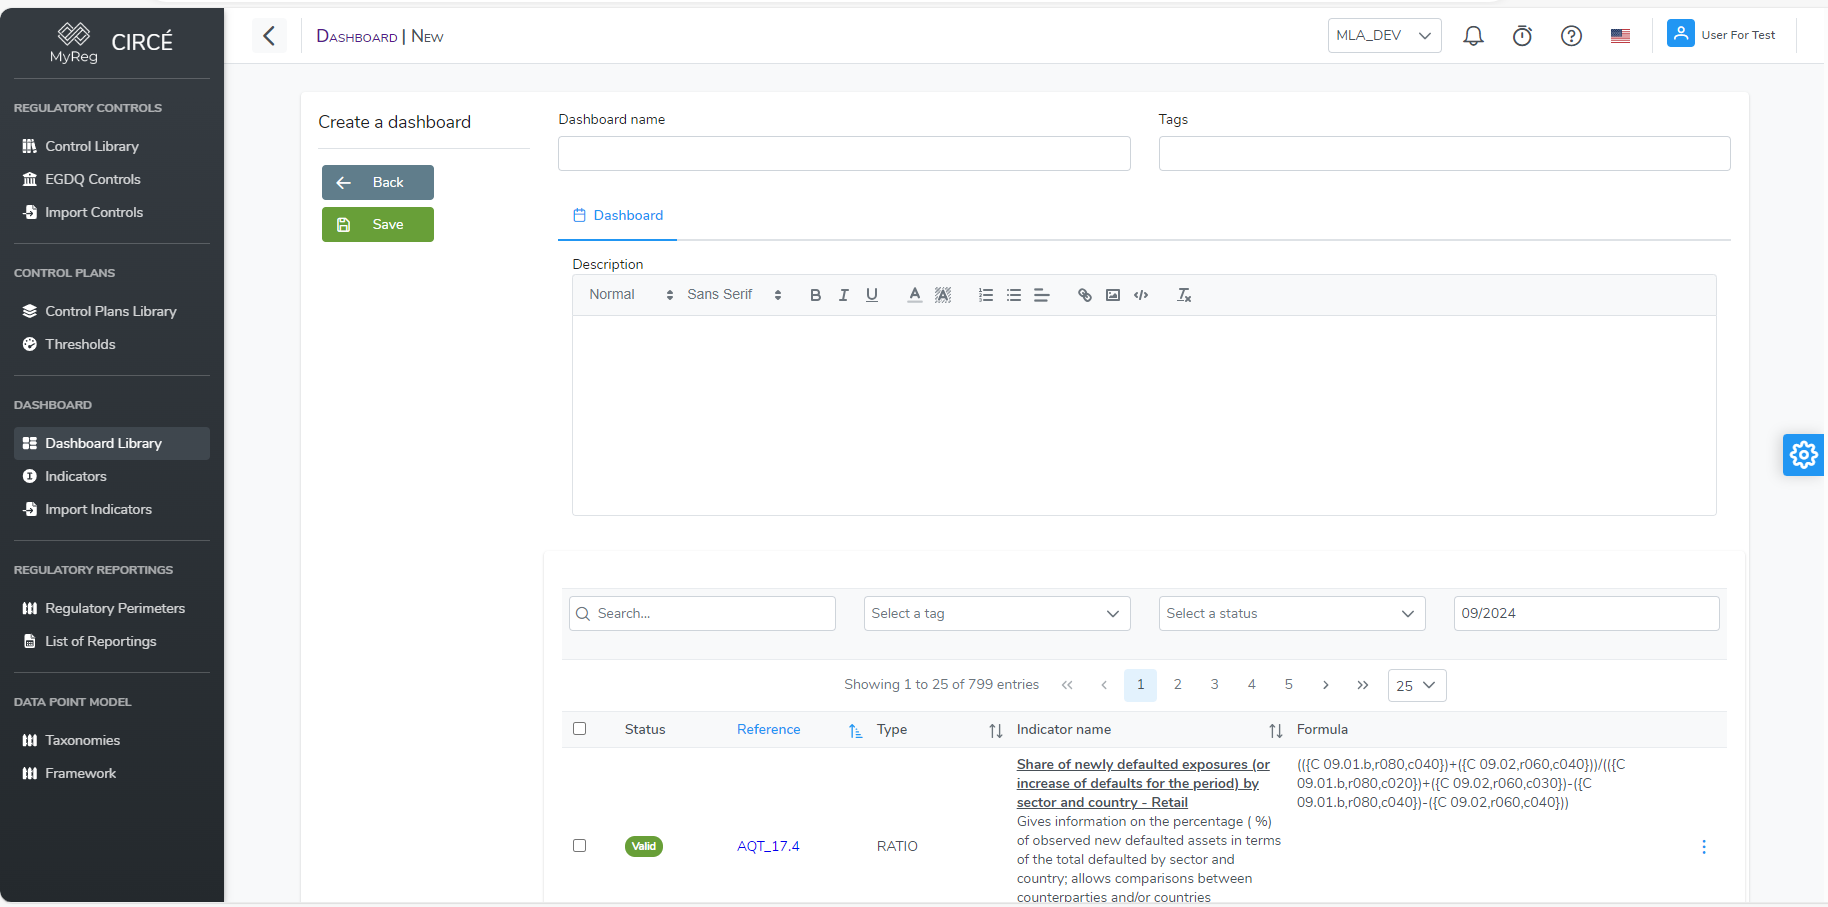
Fill in:
- the Dashboard name: required and unique;
- the Tags: optional;
- the Description, in the Dashboard tab: optional.
Then select the indicators in the Indicator List [n] tab.
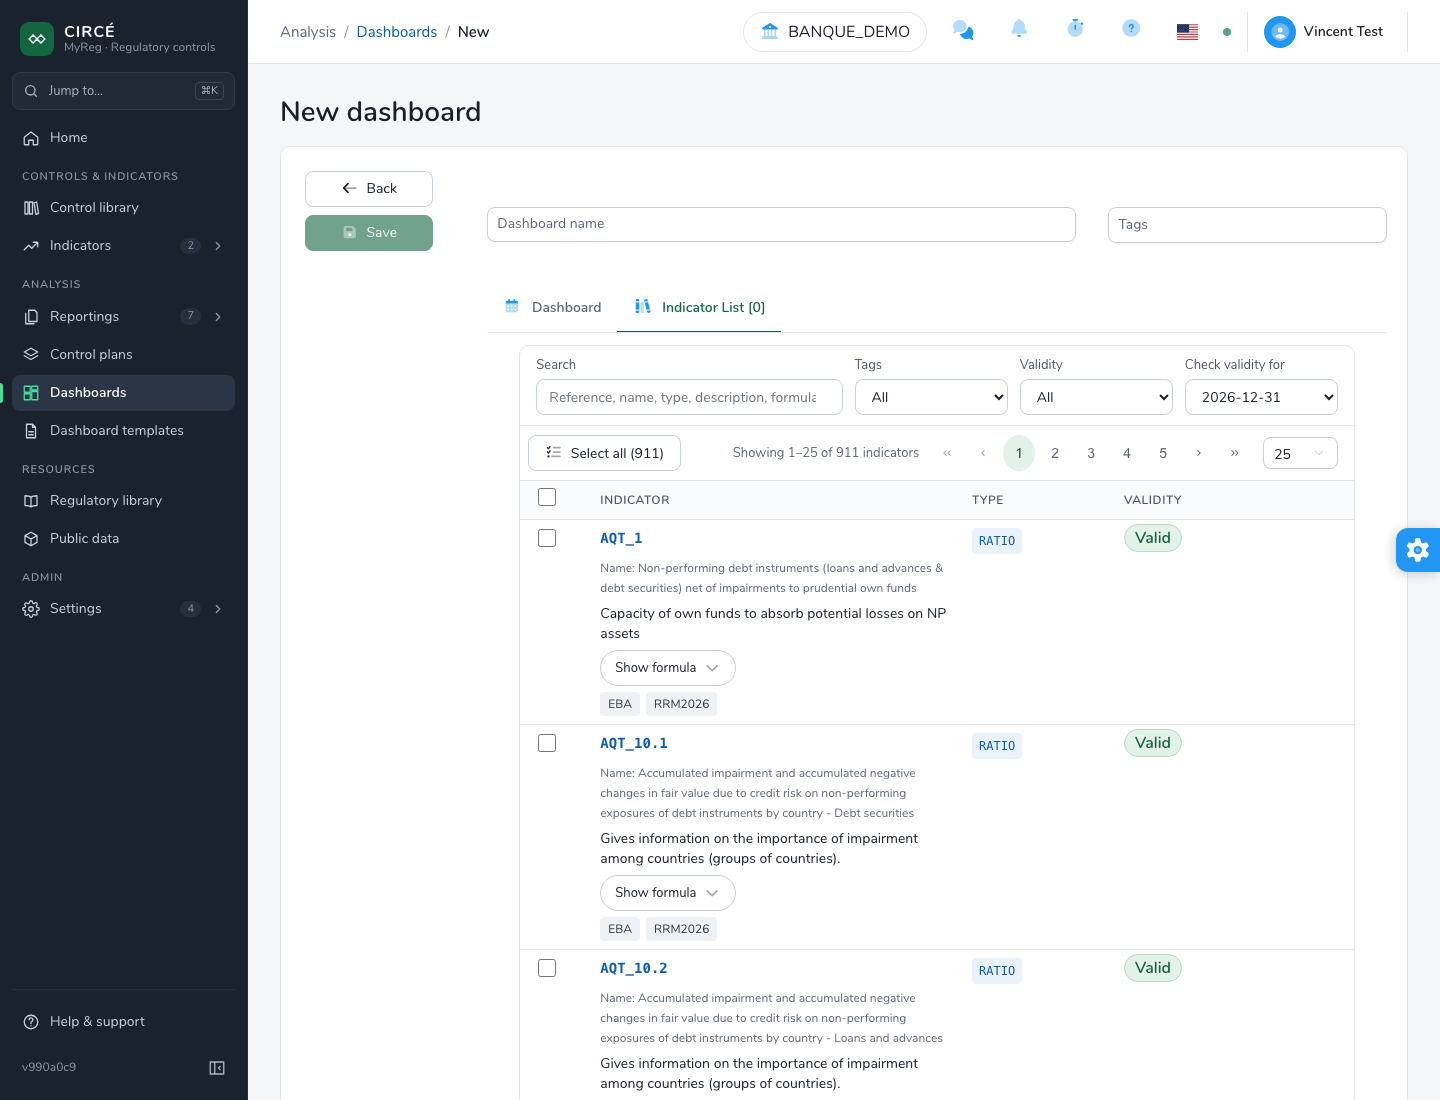
- The filters are those of the indicator list: search, tags, validity, date.
- Select all (n) checks all filtered indicators.
A dashboard can be saved without any indicator, but it cannot be executed.
How to edit a dashboard
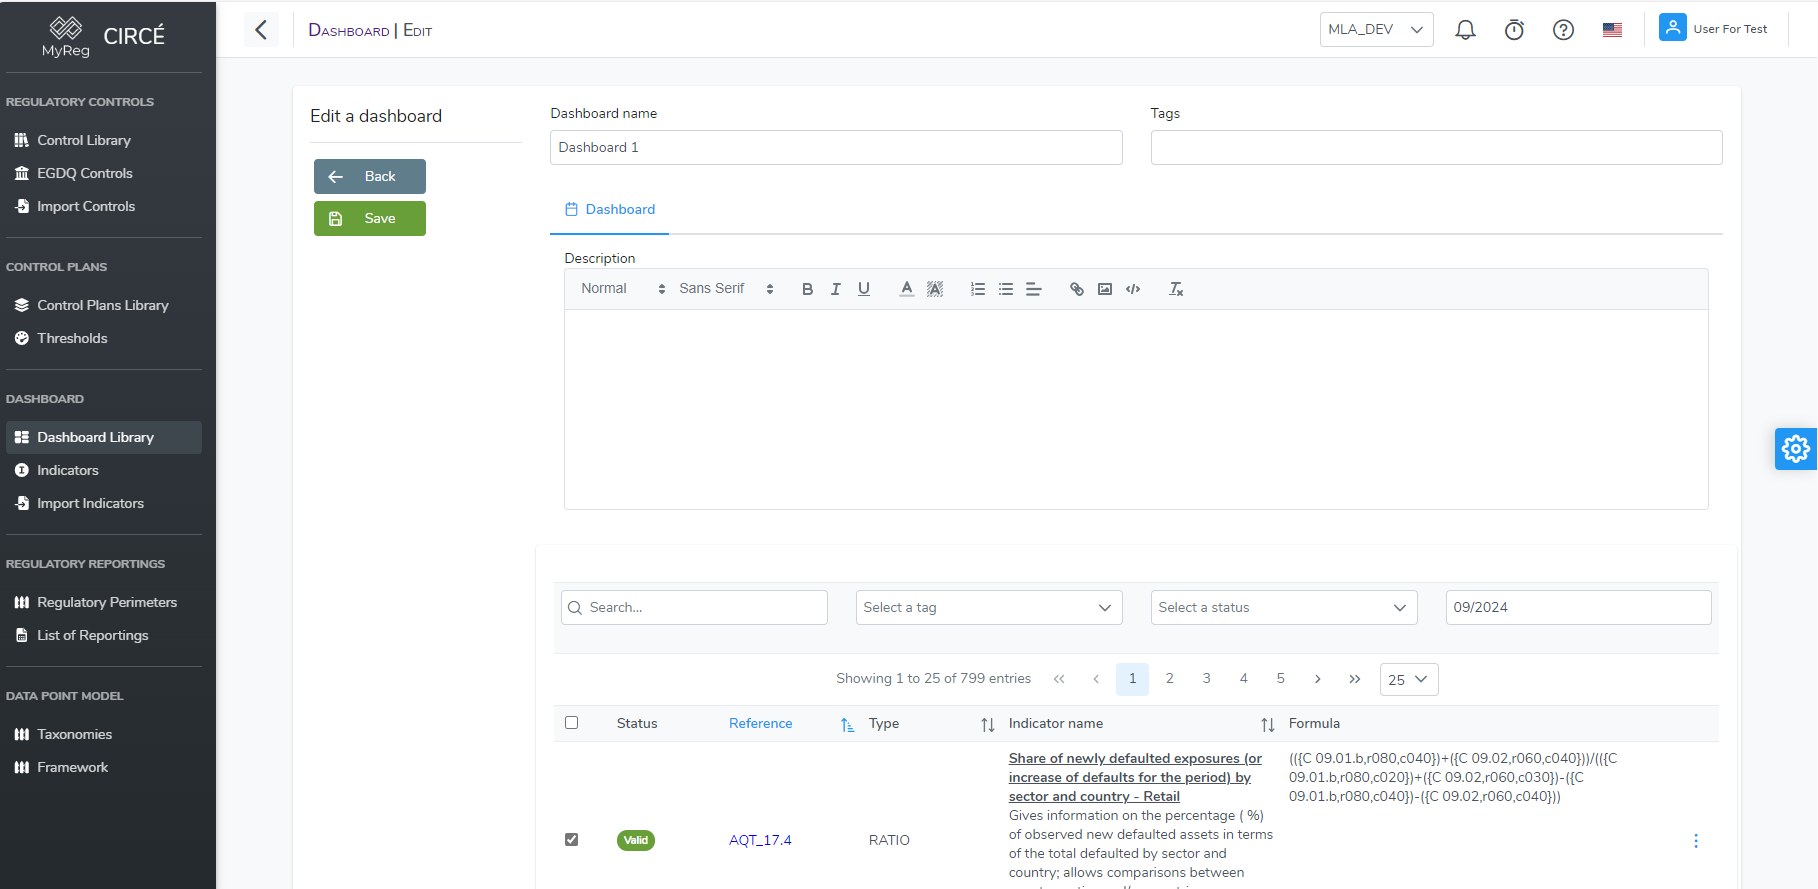
Open a dashboard and click Edit dashboard, or use the Edit entry of the ⋯ menu on the list page.
Edit the fields, or check and uncheck indicators, then click Save.
How to add or remove indicators
Add. On the dashboard page, open the More actions menu (⋯) and choose Add indicators.
- The dialog shows all indicators; those already included are checked.
- Check or uncheck indicators, then click Update.
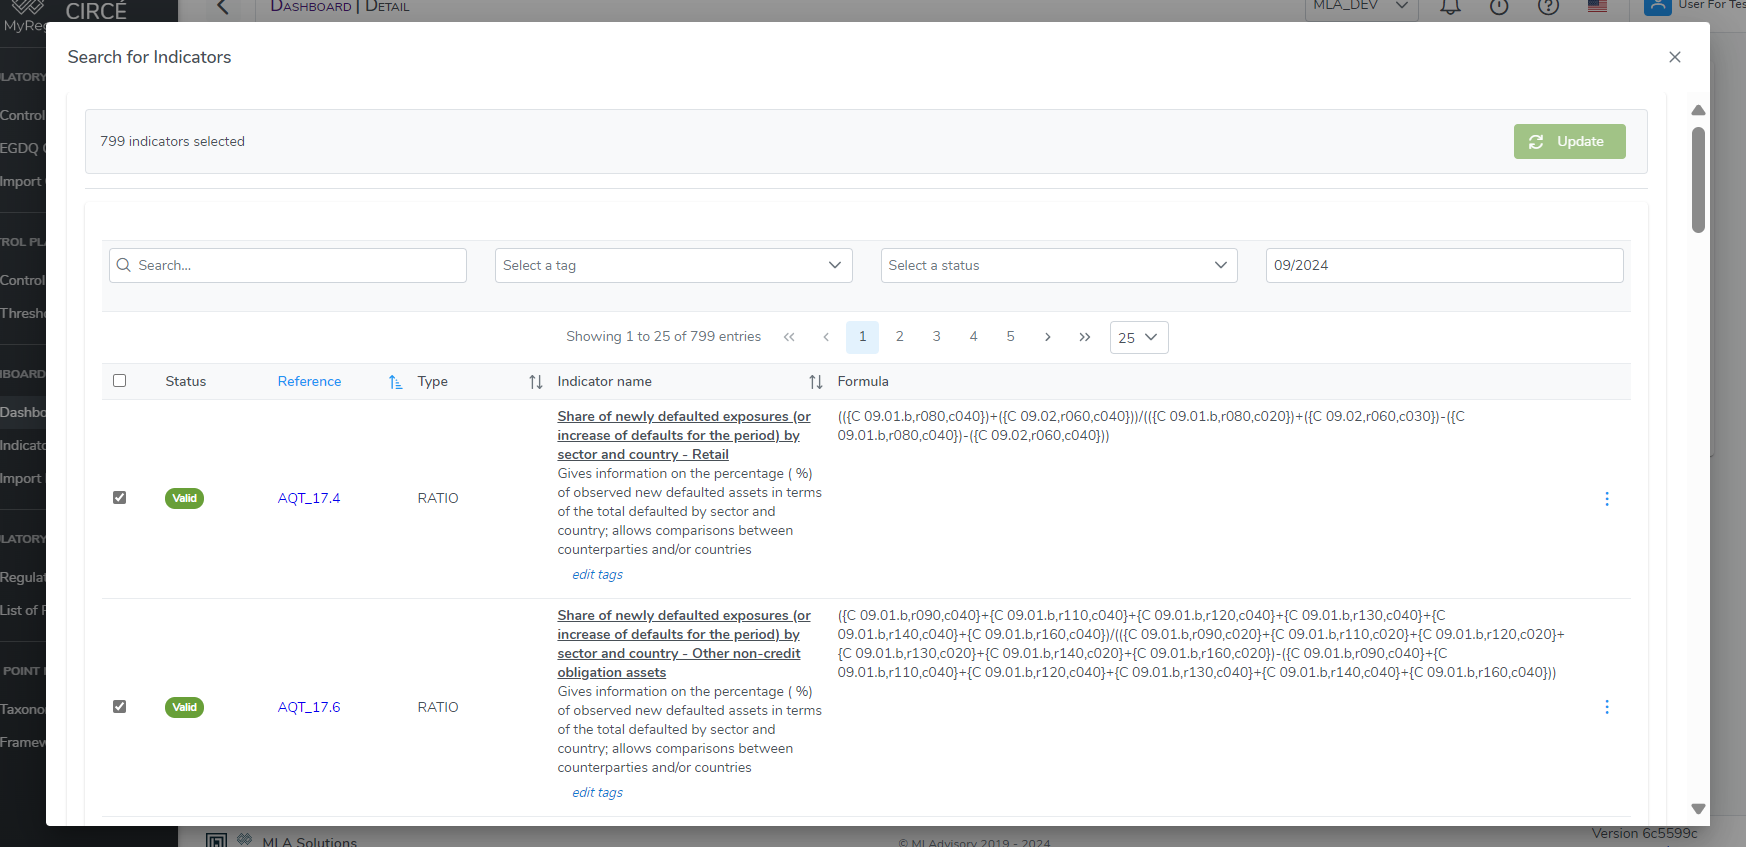
You can also start from the indicator list: see How to add indicators to a dashboard.
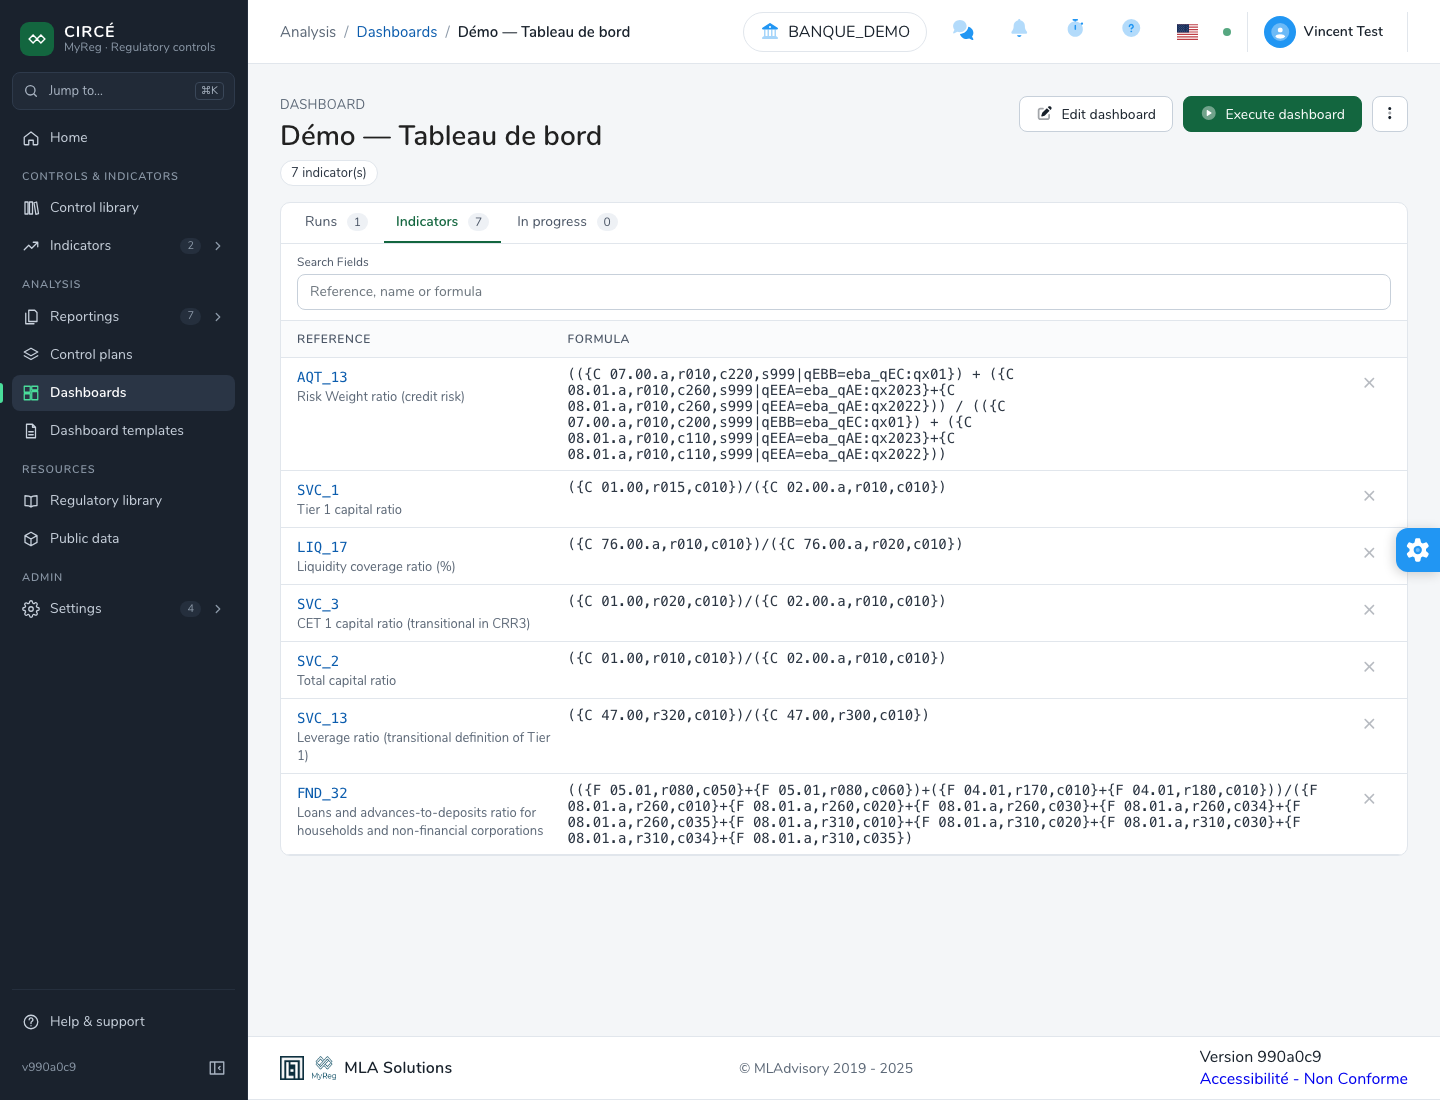
Remove. In the Indicators tab of the page, the cross on a row (“Remove … from the dashboard”) immediately removes the indicator. This tab has its own search (“Reference, name or formula”).
How to import and export dashboards
On the list page:
- Export (.xlsx), or Export selected, exports:
- the checked dashboards;
- or those carrying the filtered tags;
- or all dashboards.
- Import (.xlsx) imports a file of the same shape.
- Indicators are matched by their reference and must already exist in the library.
- A dashboard whose name already exists is skipped.
- The summary lists the existing dashboards and the indicators that could not be found.
On a dashboard’s page, More actions › Export indicators (.xlsx) downloads its indicators in the indicator export format.
How to delete a dashboard
There are several entry points:
- on the list page, the Delete entry of a dashboard’s ⋯ menu;
- to delete several, check them, then click Delete… in the action bar;
- on the dashboard page, More actions › Delete dashboard.
The deletion asks for two confirmations:
- The first names the dashboard and gives the number of runs deleted with it.
- The second asks you to confirm the permanent deletion: it cannot be undone.
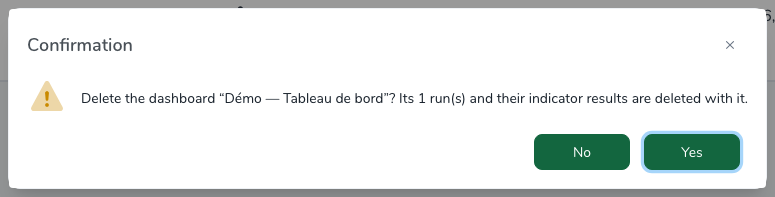
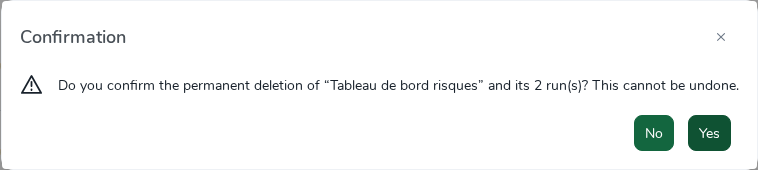
Deleting a dashboard also deletes all its runs and their indicator results.
The deletion is refused if one of these runs belongs to a team whose runs you may not delete.
How to execute a dashboard
Once your dashboard is ready, click Execute dashboard on its page.
The Build Dashboard window fills in step by step:
Choose a perimeter: it is used to find the reporting files.
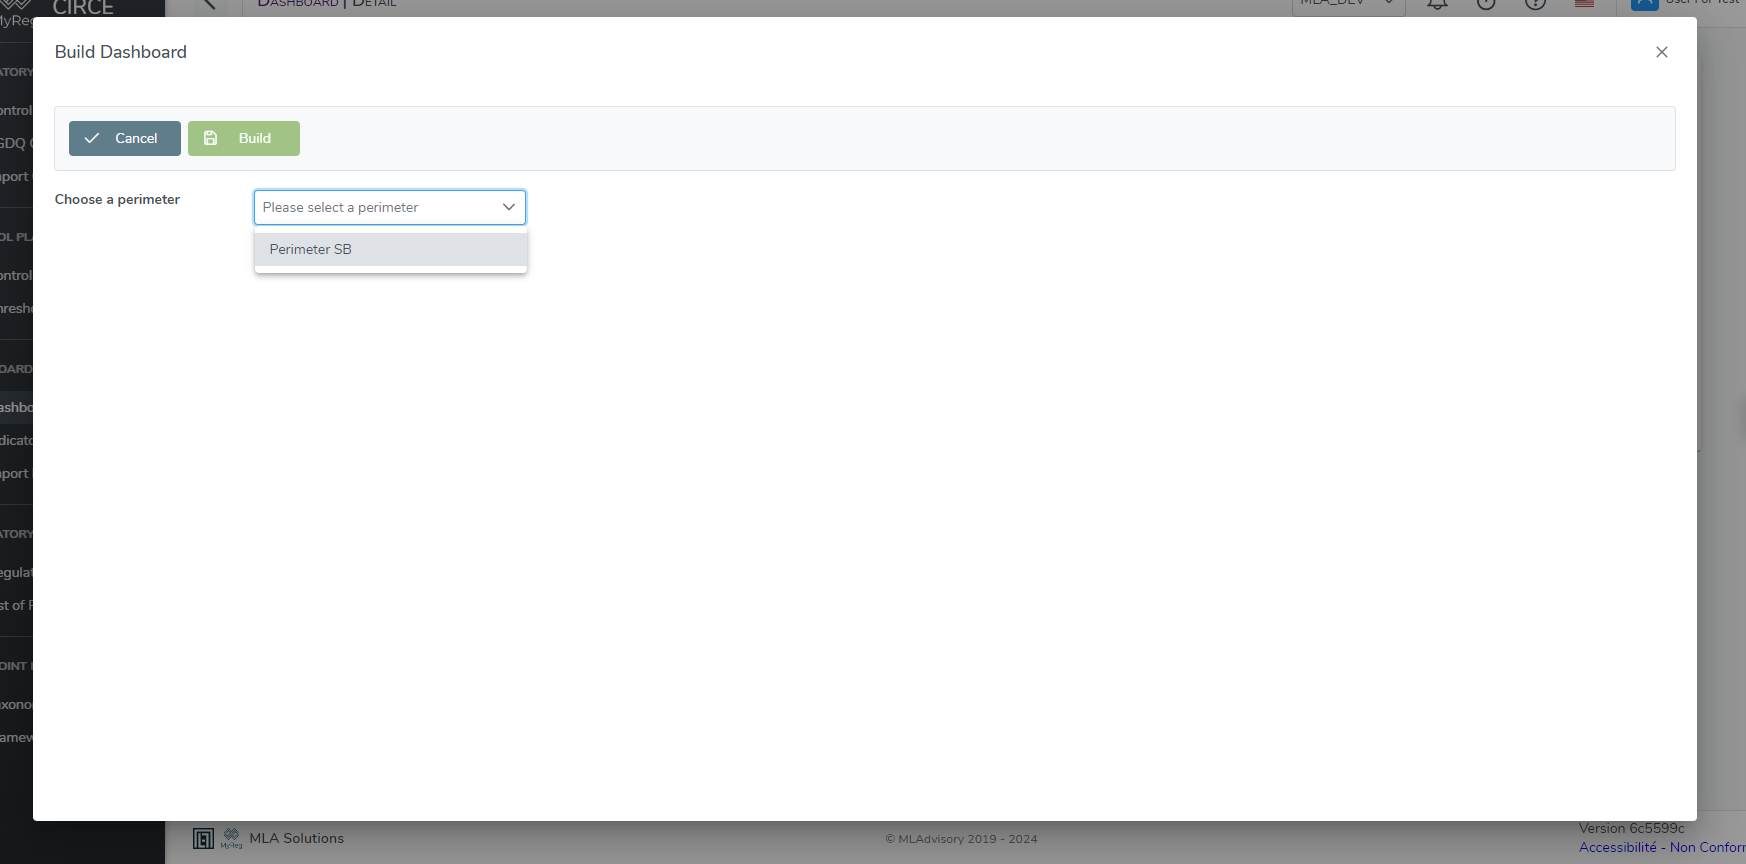
Build Dashboard: choosing the perimeter Choose a reporting date: you can choose one or more dates among those of the perimeter’s processed files. The Show only official reports option is enabled by default.
Choose a period type: Month, Quarter (default), Semester or Year.
Check the files to use. They are grouped by date, and at least one file must be checked.
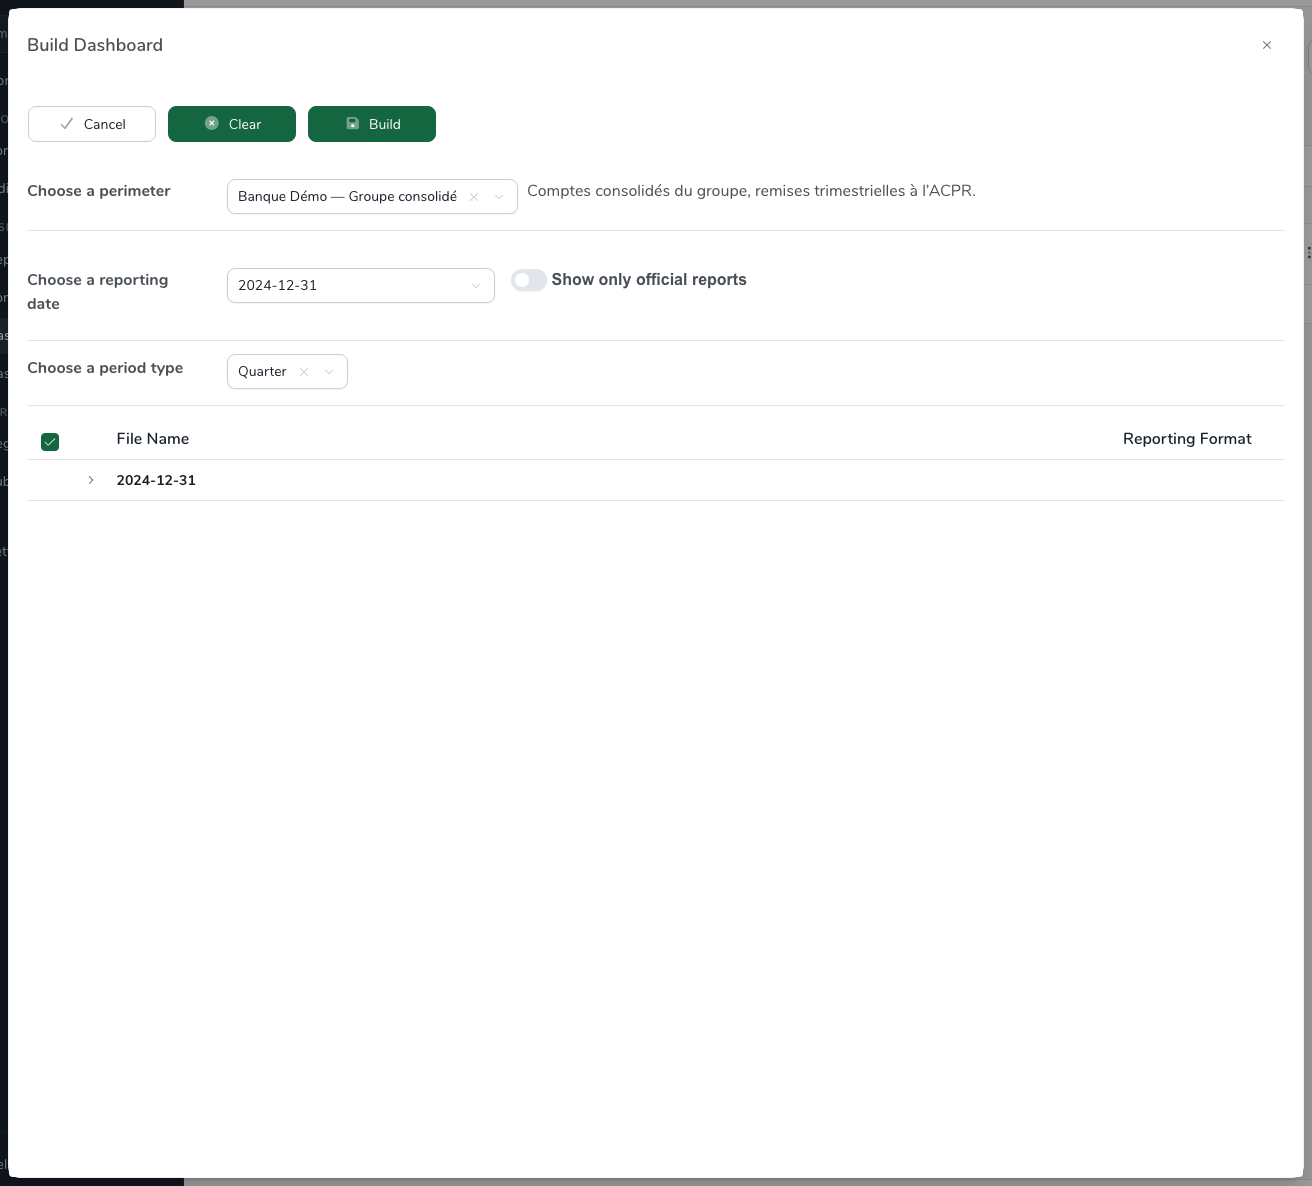
Build Dashboard: choosing the files
Click Build.
- The reporting dates of the result are those of the checked files.
- The run appears in the In progress tab, with a progress bar that moves in real time. Once finished, it moves to the Runs tab.
- A run whose results cannot be saved fails instead of staying “in progress”. It then appears in the Failed tab.
An indicator whose status is not Valid for the taxonomy in force is not evaluated: its value is NaN.
Viewing the results
The header of a dashboard page shows its number of indicators, its description and its tags. It carries the following actions:
- Edit dashboard;
- Execute dashboard;
- More actions (⋯): Add indicators, Export indicators (.xlsx), Delete all runs and Delete dashboard.
The page has the following tabs:
- Runs: the finished runs, newest first. Each row shows:
- Run: its date, which opens the result, and its number of indicators;
- Reference date: its reporting dates;
- Duration;
- Results: a bar and the number of indicators per review status (validated, validated with reserves, not validated, not evaluated). Each number opens the result filtered on that status.
- Indicators: the dashboard’s indicators.
- In progress: the running executions and their progress.
- Failed: the runs that stopped on an error without producing results. This tab only appears when there are some.
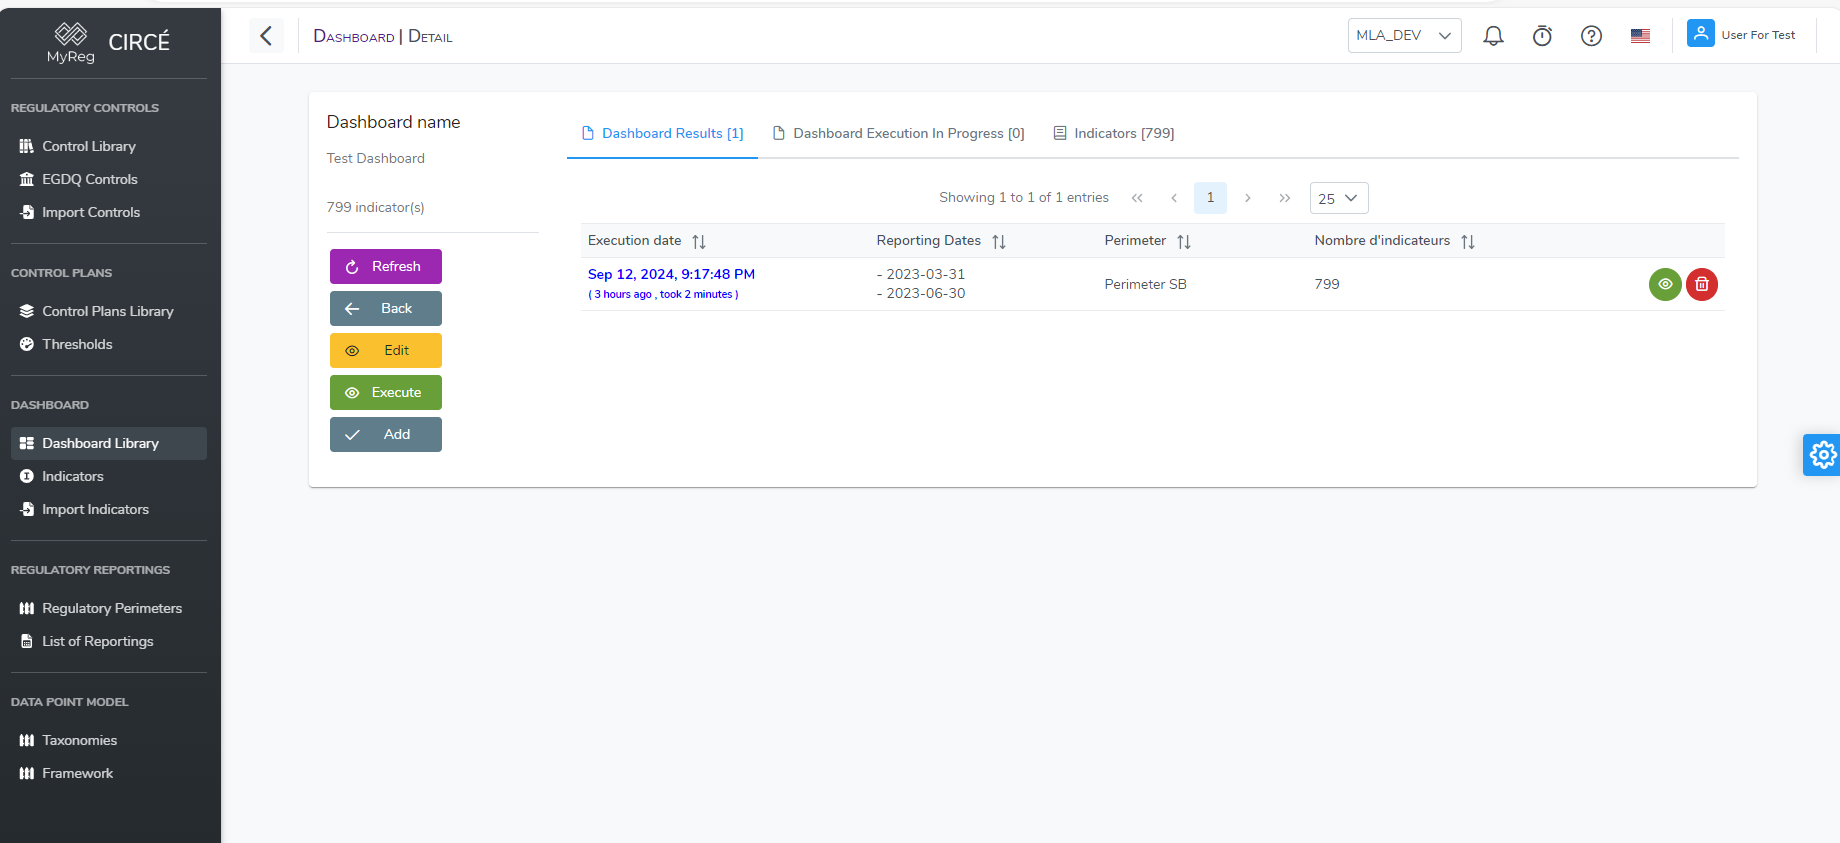
On a run row, Open shows the result. The ⋯ menu offers:
- Execute: re-runs the dashboard on the same files and the same period type, without a dialog;
- Delete: deletes this run, after two confirmations.
More actions › Delete all runs deletes all finished or failed runs, also after two confirmations.
The pages update themselves when a run progresses or finishes.
The result page
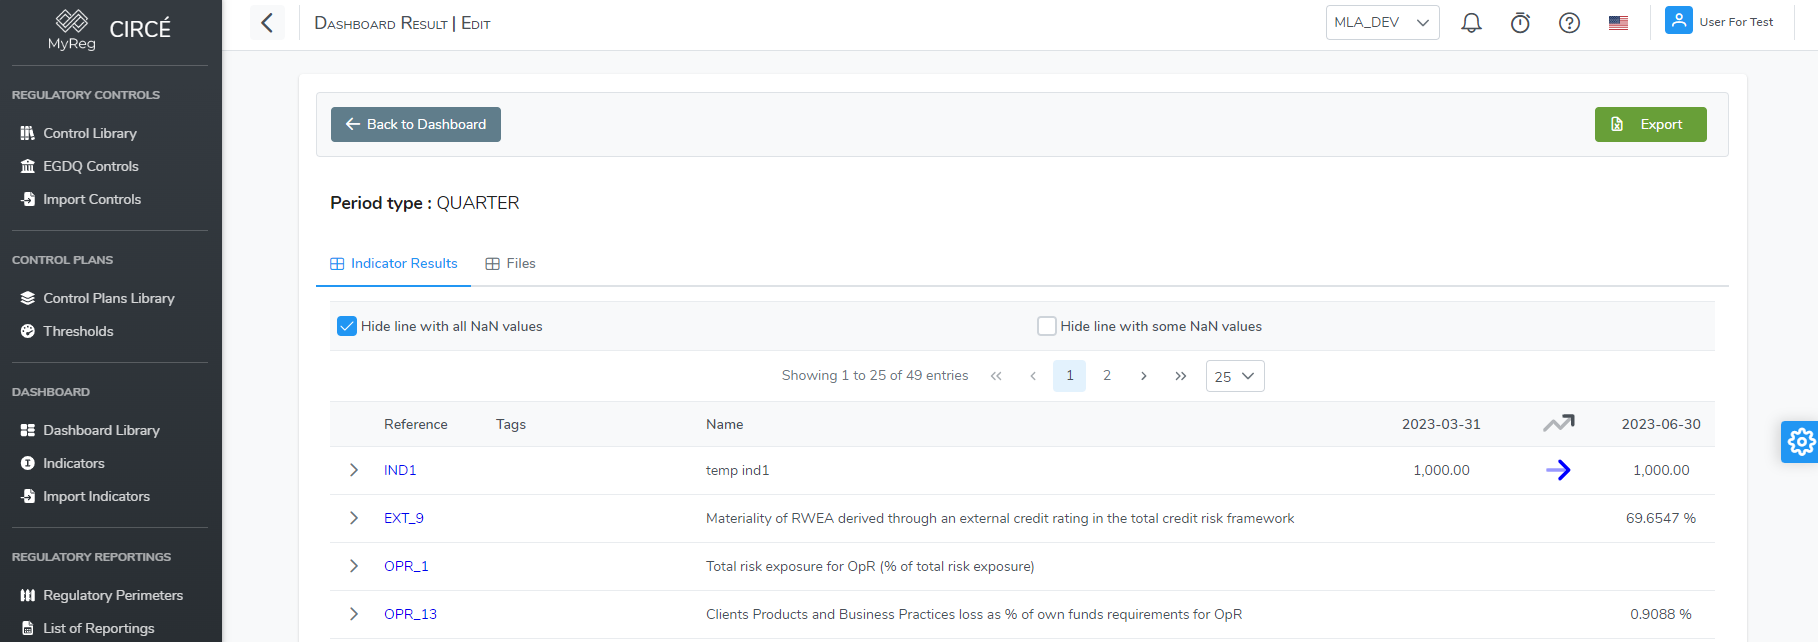
The Dashboard result page has three tabs. The Back to Dashboard button returns to the dashboard page.
The Indicator Results tab shows one block per indicator, with:
- the table of values by date, with the absolute (Delta (abs)) and relative (Delta (rel)) differences.
- The relative difference is measured against the absolute value of the previous value: (value − previous) / |previous|. Its sign therefore follows the direction of the change, even when the previous value is negative.
- Arrows show the direction of the change.
- A change greater than one standard deviation is highlighted.
- the mean, minimum, maximum and standard deviation;
- a chart of the evolution, with the mean and the one- and two-standard-deviation bands;
- the review elements: a status (Validated, Validated with reserves, Not validated), a priority (P0 to P3) and comments.
- Status and priority are saved as soon as they are changed.
- These elements are specific to this result.
- tags specific to the result, and the links to the result details and to the indicator.
The filters of this tab are:
- Search keyword, on the reference;
- Tags, Priority level and Status;
- Variation: increase, decrease and/or stable;
- Higher variation than: a percentage;
- “Hide lines with some NaN values”, enabled by default, and “Hide lines with only NaN values”;
- Show Audit Trail: shows the data point values of each indicator;
- Show Workflow Elements: shows the review elements;
- Clear Filters.
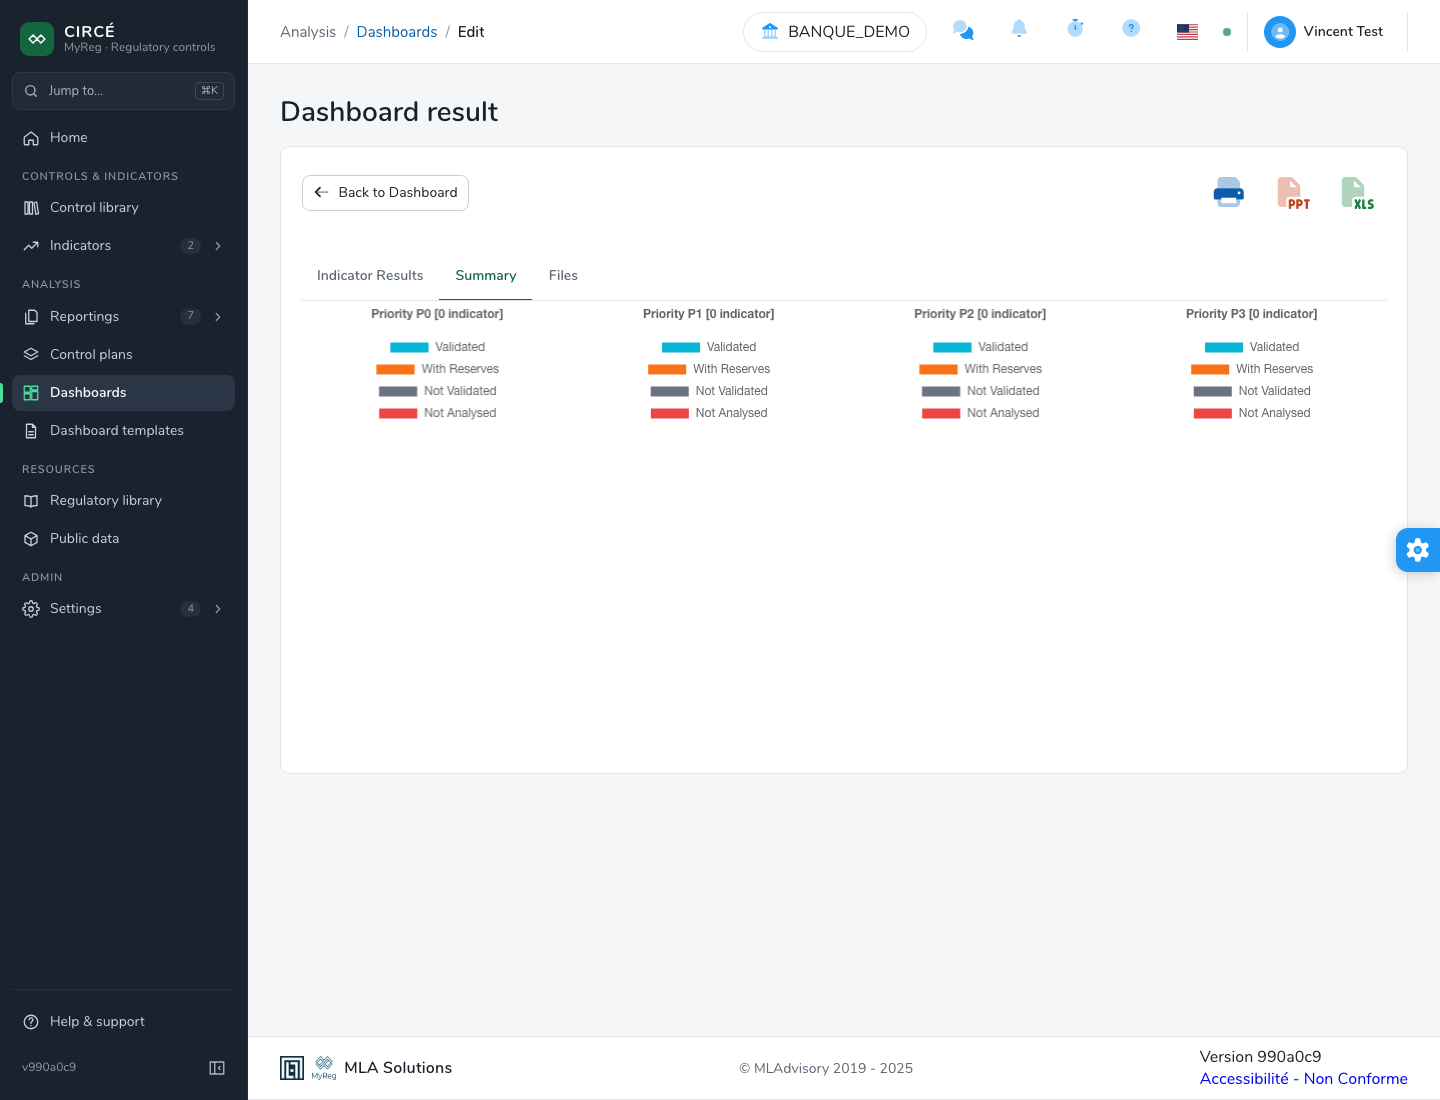
The Summary tab shows a pie chart per priority level, broken down by review status.
The Files tab lists the files used, with their date, format and perimeter.
How to export a result
The three icons at the top right of the result page offer:
- Print: opens the result in a new tab, without menus, ready to print with the browser’s print function.
- PowerPoint: one slide per indicator, with the table of values, the chart, the status, the priority and the comments.
- Excel: three sheets:
- IndicatorResults: values, differences (variations in %), statistics, status and priority;
- AuditTrail: the data points;
- Filters: the filters applied, including the searched keyword.
The PowerPoint and Excel exports contain exactly what the filtered screen shows: they apply all the page filters, including the keyword, the tags, the NaN options, the status (including “not evaluated”), the priority and the variation.