Public data
This chapter only applies to installations where the Public data module is enabled for your organisation. Otherwise, the menu entry does not appear.
The Resources › Public data page gives access to the data published by the ECB, the EBA and other sources, stored as cubes: each cube is a set of series described by dimensions (country, sector, indicator, etc.), in the SDMX format. These data serve as a reference to place your institution against the market.
The cubes are loaded and kept up to date by the platform administrators. In the application, these pages are read-only: you can neither import a cube nor start an update.
The available sources
The referential keeps the following cubes up to date by itself:
| Source | Content | Update |
|---|---|---|
| ECB | Supervisory ratios, MFI interest rates, yield curve, €STR, reference exchange rates, Euribor, residential property prices, stress indicators (CISS, CLIFS), bank lending survey, loans and deposits of non-financial corporations and households, etc. | Every day |
| EBA Risk Dashboard | The data annex, one sheet per cube: KRIs, KRI distributions, numerators and denominators. Added to it: the credit risk parameters (default rates, PD, LGD) and the risk assessment questionnaire. | Every week |
| EBA transparency exercise | The bank-by-bank data: capital, RWA, profit and loss, sovereign exposures, credit and market risk. | Every week |
| EBA stress test | The bank-by-bank data of the EU-wide stress test: actual figures, restated starting point, baseline and adverse scenarios. | Every week |
| ECB list of MFIs | The monetary financial institutions, with their LEI, city and group head. | Every week |
| List of SSM supervised entities | The significant and less significant institutions, their group and the reason for their significance. | Every week |
Other sources may appear on the Automatic updates page marked Paused: they are not fed yet and their data are not available.
The cube list
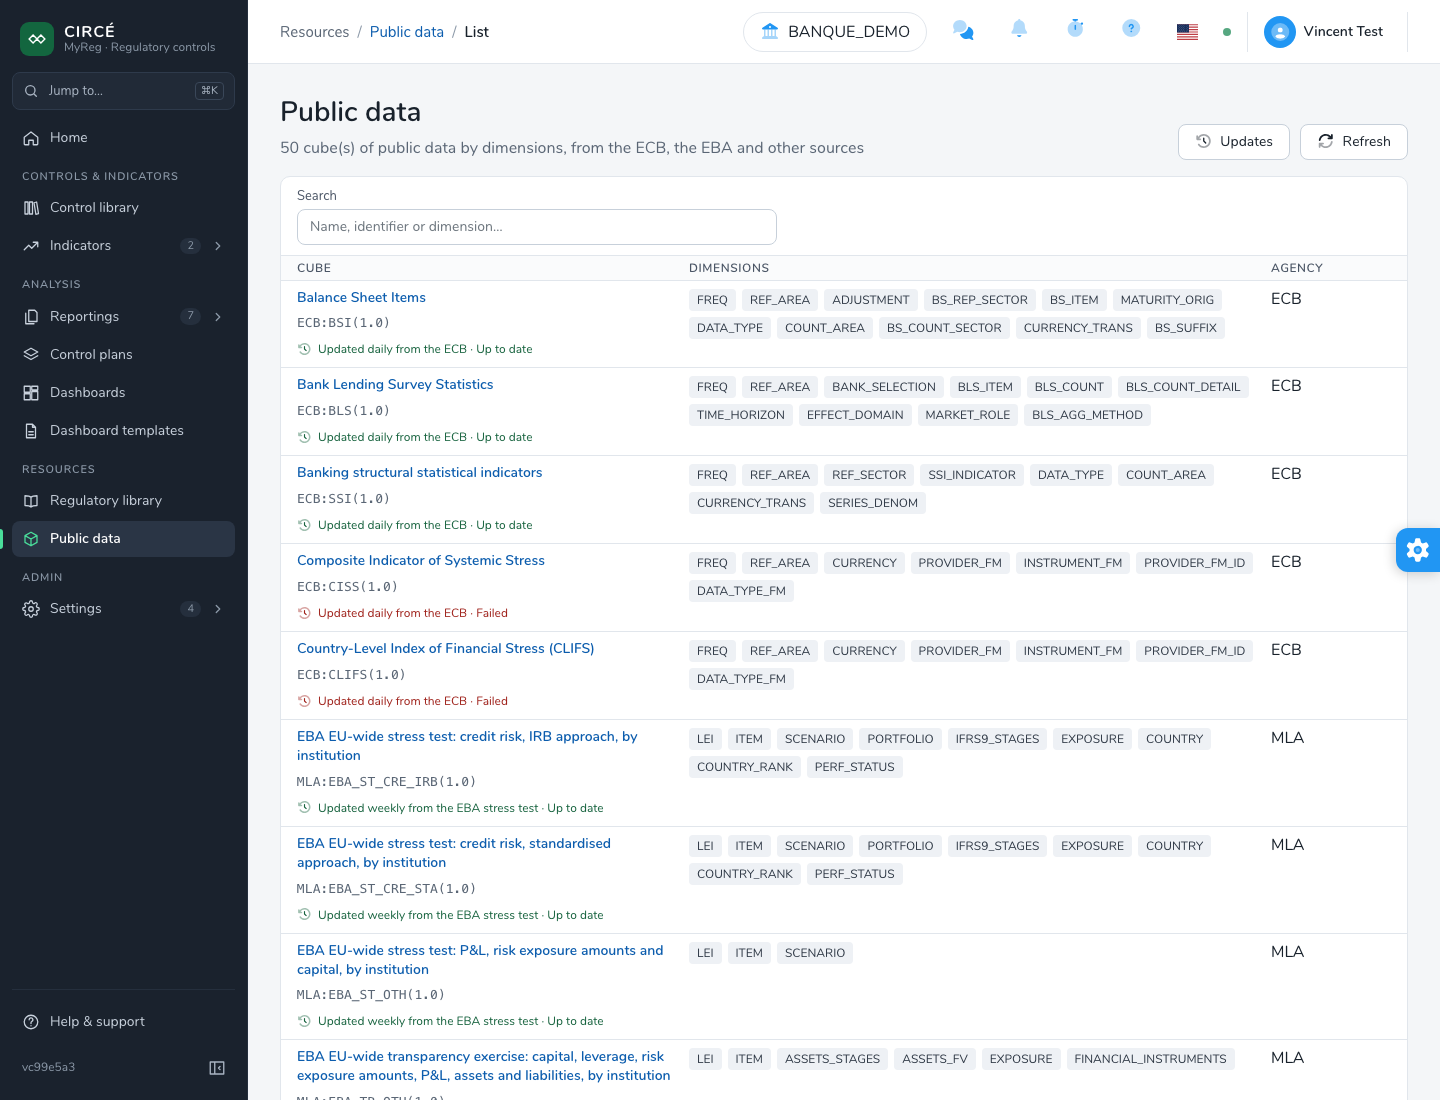
The Public data page lists the cubes with:
- their name, which opens the explorer, and their reference
agency:identifier(version); - for a cube kept up to date automatically, its frequency, for example “Updated daily from the ECB”, and the state of its last update;
- their Dimensions;
- their Agency.
The Search field filters on the name, the identifier or a dimension. Refresh reloads the list. Updates opens the Automatic updates page.
How to explore a cube
Click a cube’s name to open the explorer.
Choosing the series
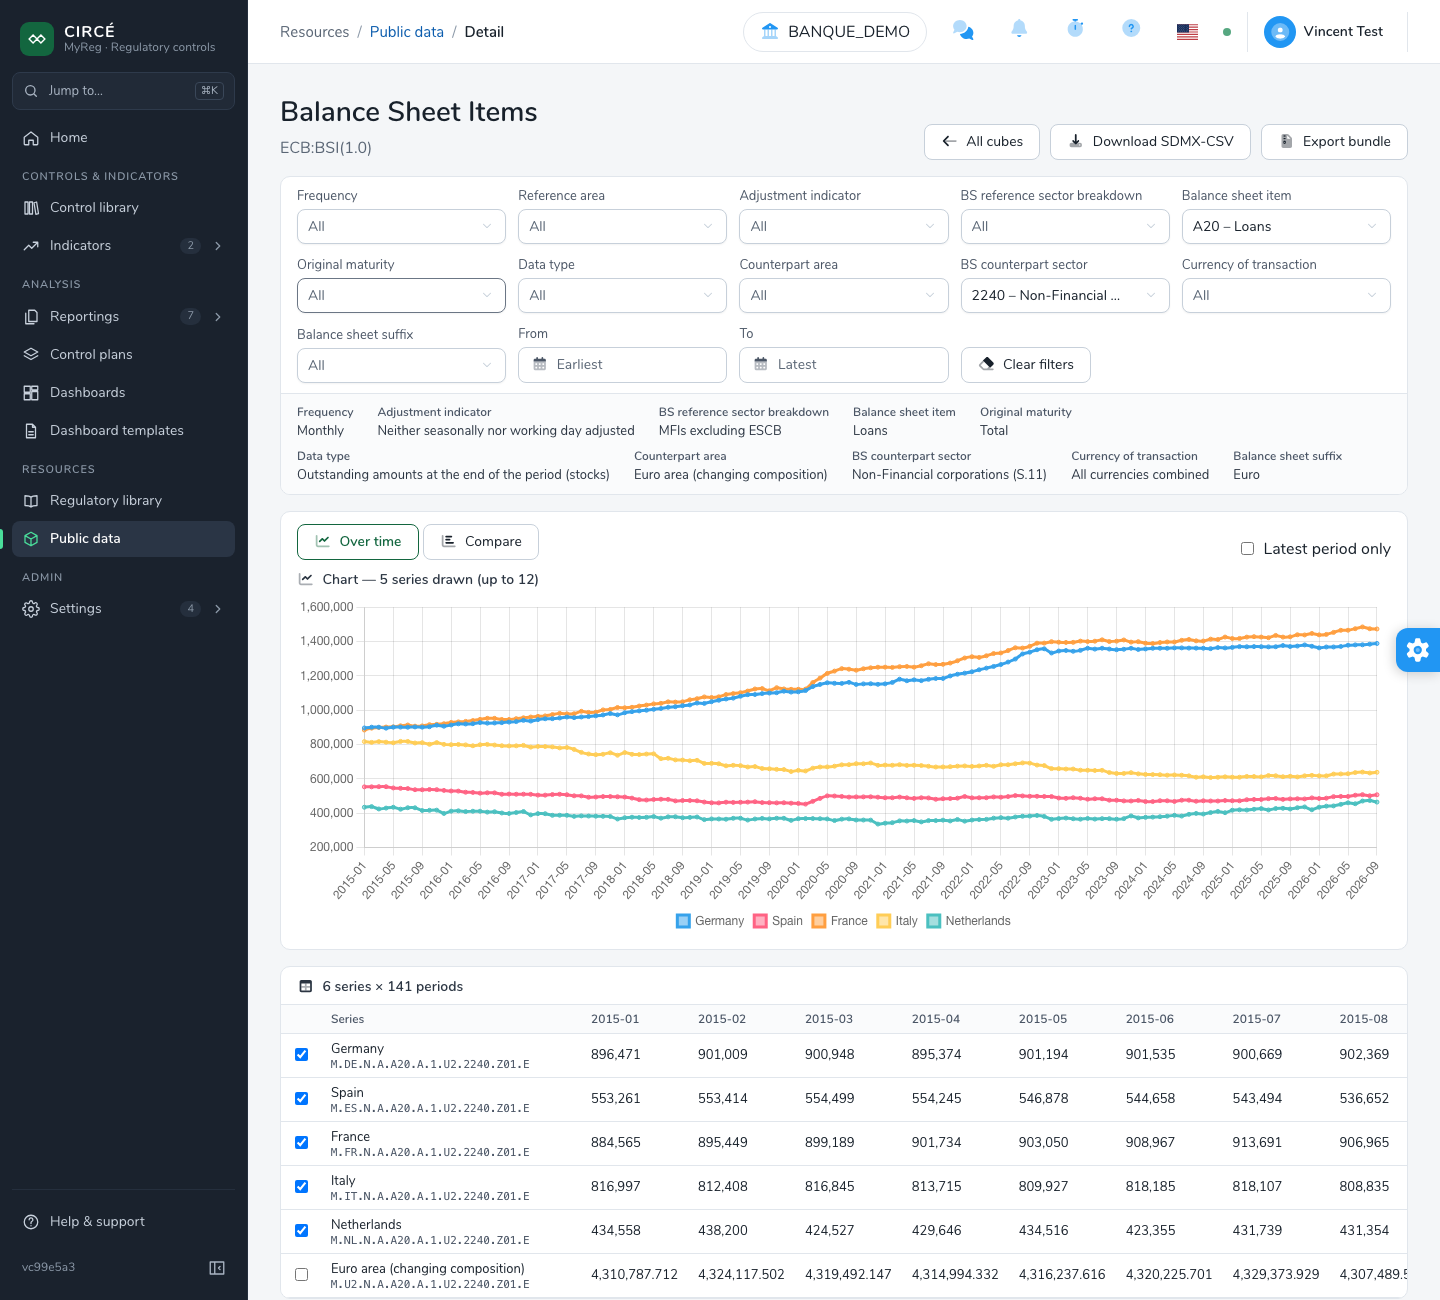
- Each dimension has its list of codes. By default, it is All. The selection applies when the list closes: there is no confirm button.
- The From and To fields bound the period. Choose a year, then a quarter, a semester or a month, depending on the cube’s frequency, or Whole year. The years that hold data stand out.
- Clear filters goes back to the whole cube.
On opening, the explorer shows a first selection of comparable series, and the filters show this selection.
Above the results, a strip recalls:
- the dimensions that have a single code in the selection;
- the attributes of the dataset;
- the Totals rules: how a total is derived from its members (sum, average, weighted average, end-of-period or start-of-period value, or not derivable from the members).
When the selection is too large, the explorer shows “Too many series to show”. Pick codes in one or more dimensions: the series show as soon as the selection is small enough.
Reading the data
Two views are offered.
- Over time: a table of the series by period, and a line chart of the series ticked in the Chart column, up to 12 series.
- Compare: a bar chart that compares the codes of one dimension. Choose the dimension in Compare by and the Period, or Latest of each series. Totals are drawn as solid, outlined bars. Beyond 6 combinations of the other dimensions, only the first ones are shown: narrow the filters to compare the others.
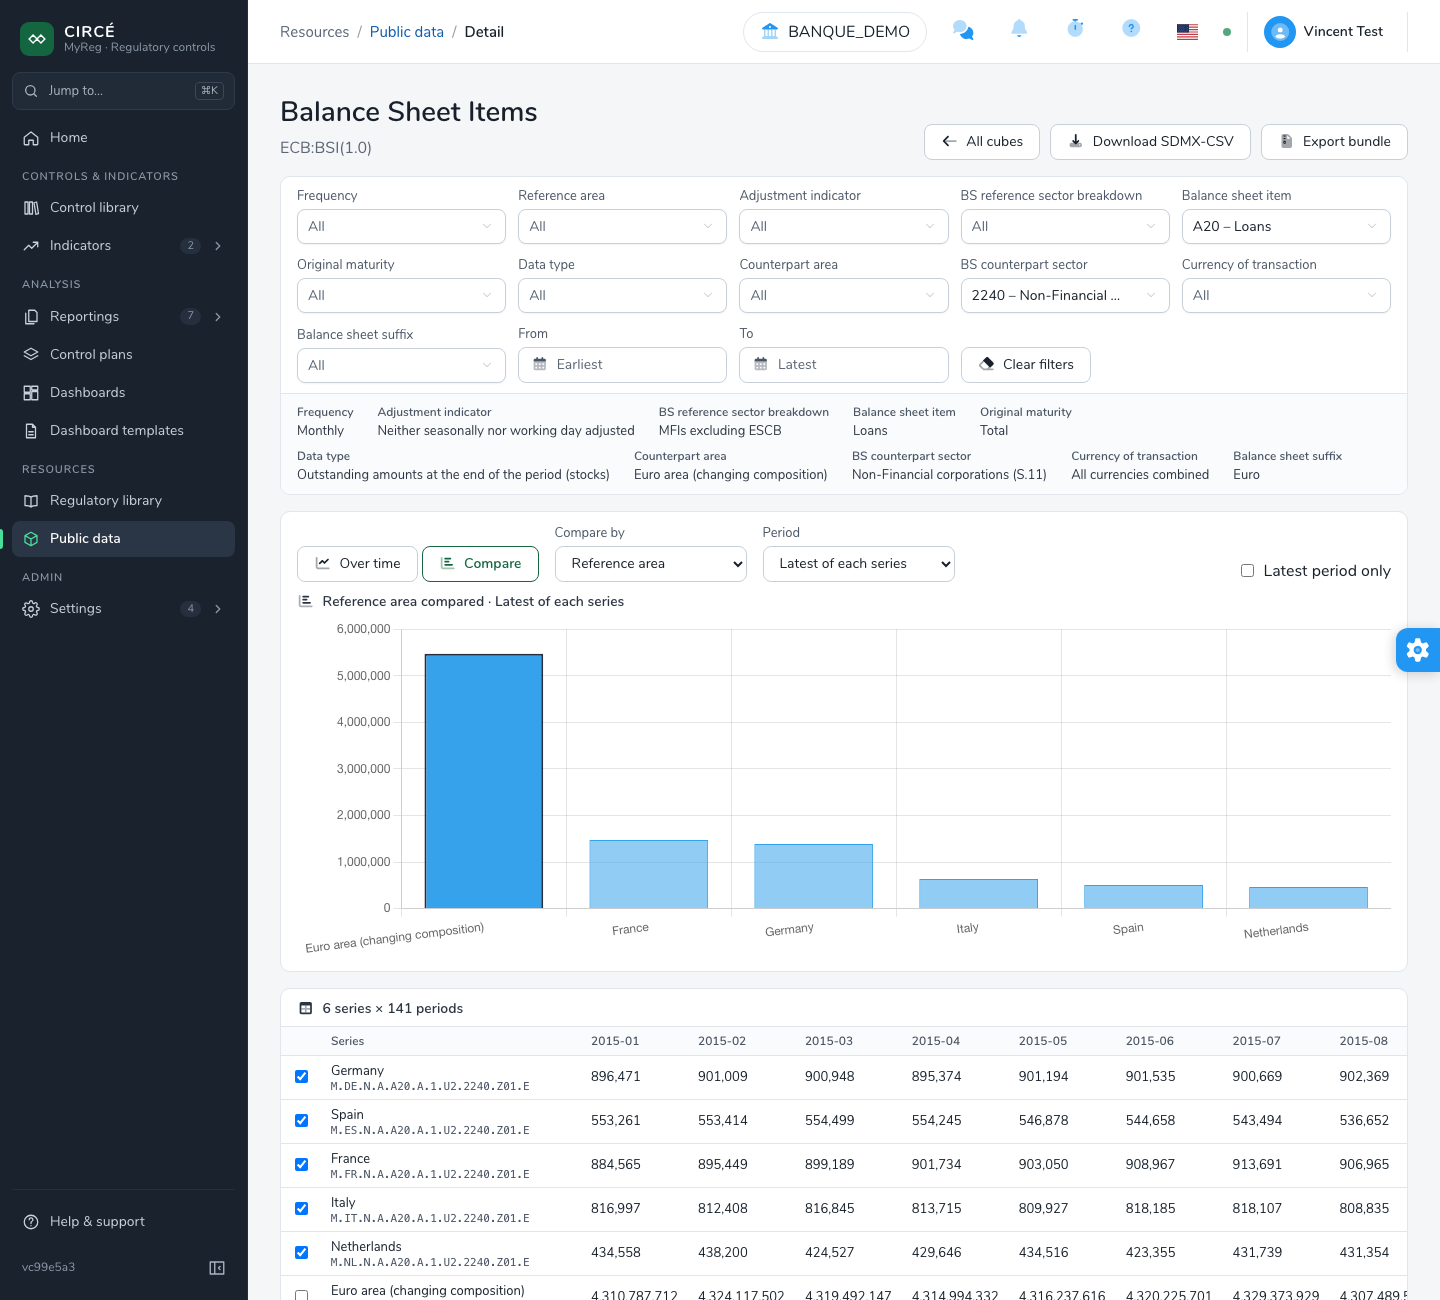
The Latest period only checkbox keeps only the latest value of each series, with its period.
In the table, a dash marks a missing value. An observation whose status is not normal (provisional, estimated, etc.) carries this status as a superscript.
Downloading the data
- Download SDMX-CSV downloads the data in the SDMX-CSV format, which opens in Excel.
- Export bundle downloads the whole cube, structures and data, as one zip, to import it into another environment.
All cubes goes back to the list.
Automatic updates
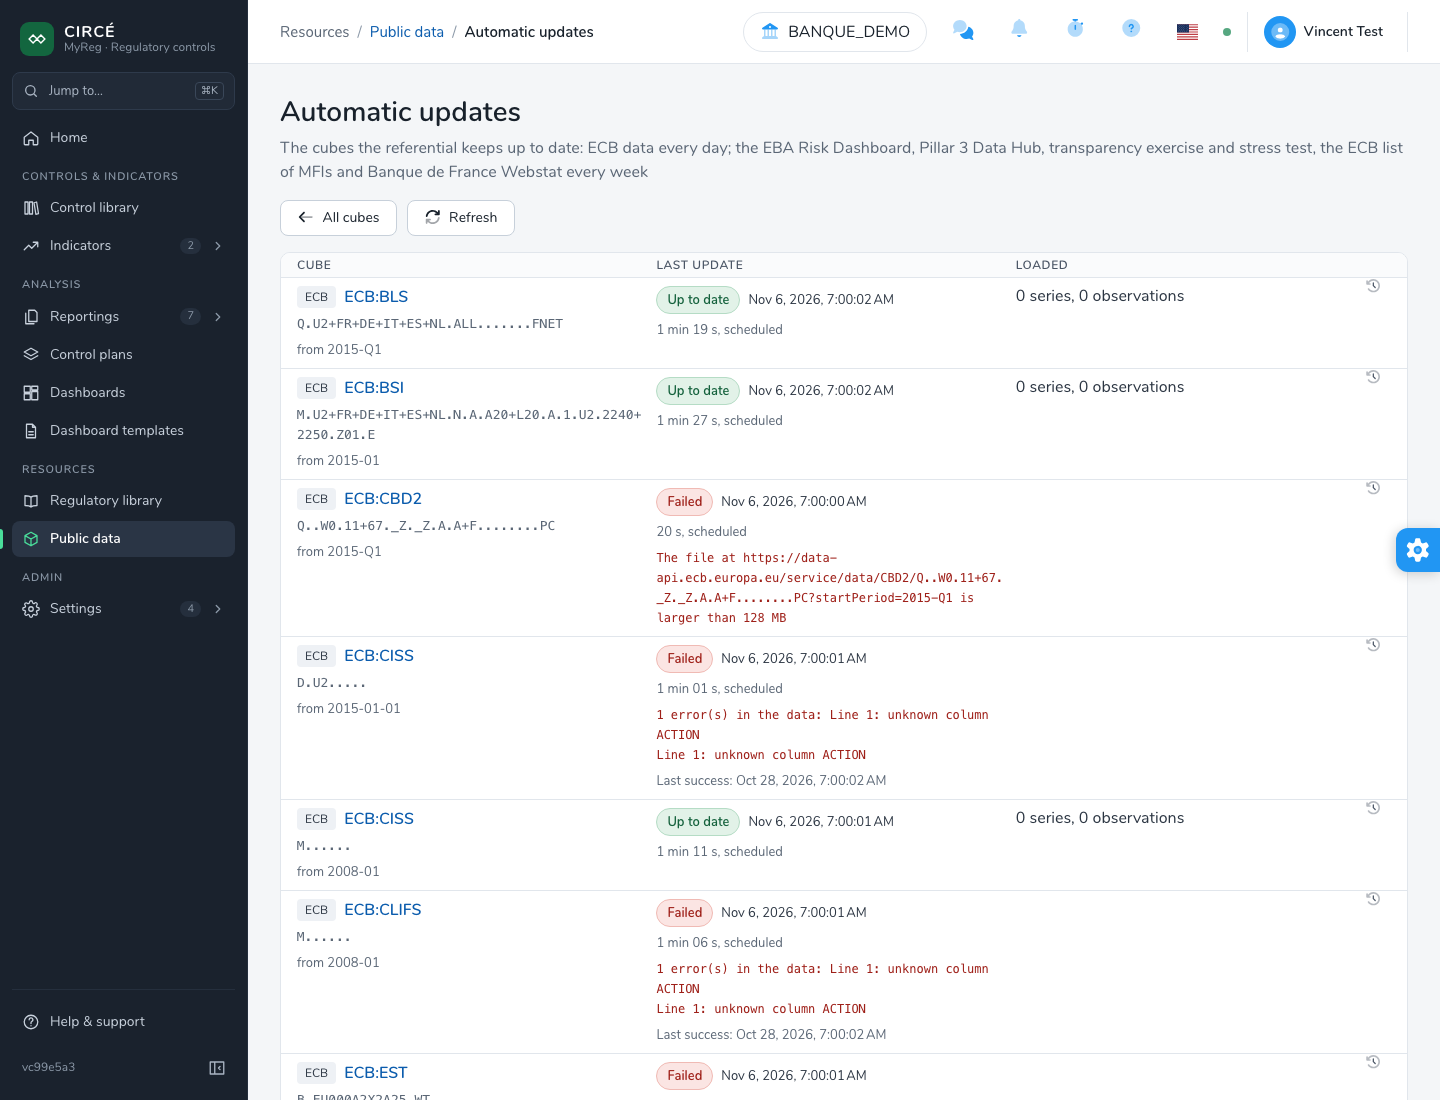
The Automatic updates page lists the cubes the referential keeps up to date. It is read-only.
For each cube, it shows:
- the source (ECB, EBA annex, EBA transparency exercise, EBA stress test, ECB list of MFIs, etc.) and the cube reference, which opens the explorer;
- the Paused mention if the source is not fed;
- the Last update: its state (Updating, Up to date or Failed), its date, its duration, whether it was scheduled or started by hand, and the reason for a failure. After a failure, the date of the last success is recalled;
- what was Loaded: the number of series and observations, and the source file.
The history icon shows the cube’s Update history.
Where these data are also used
If the Pillar 3 module is enabled, the peer comparison pages of the Pillar 3 workbooks rely on these data: Risk Dashboard distributions, EBA transparency exercise and stress test.