Taxonomies and frameworks
The Frameworks & Taxonomies page is found under Admin › Settings › Frameworks & Taxonomies. It lets you navigate the DPM, that is, the templates, cells and taxonomy versions known to the platform.
The page has three tabs: Frameworks, Taxonomies and Data points. It opens on the Frameworks tab. All three tabs read the DPM v2 database. Its versions are shown in the Settings.
This chapter also describes two pages of the Analysis > Reportings group that rely on the DPM: Generate XBRL and FINREP from BIRD.
Taxonomies
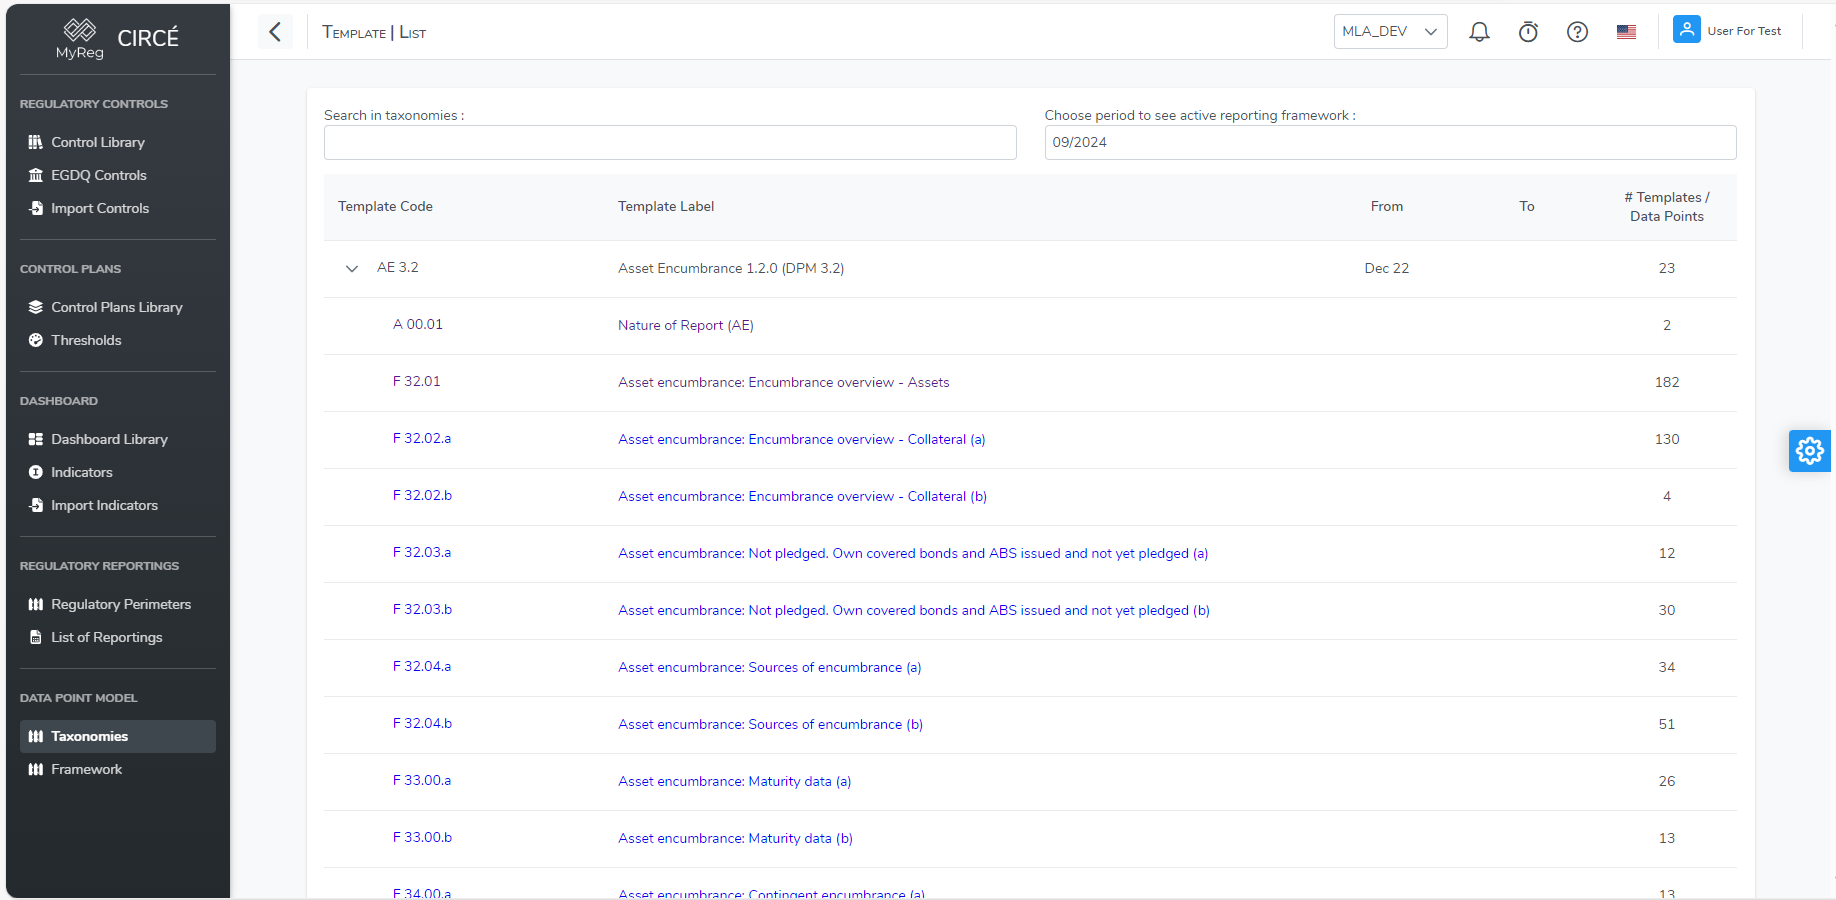
The Taxonomies tab shows the taxonomies in force at a given date.
The tab settings are as follows:
- Search in taxonomies: searches codes and labels.
- Choose period to see active reporting framework: the reference month, by default the current month. The calendar picks a month, not a day.
The list is a tree:
- Each taxonomy shows its start date and its number of templates.
- A taxonomy expands to show its templates.
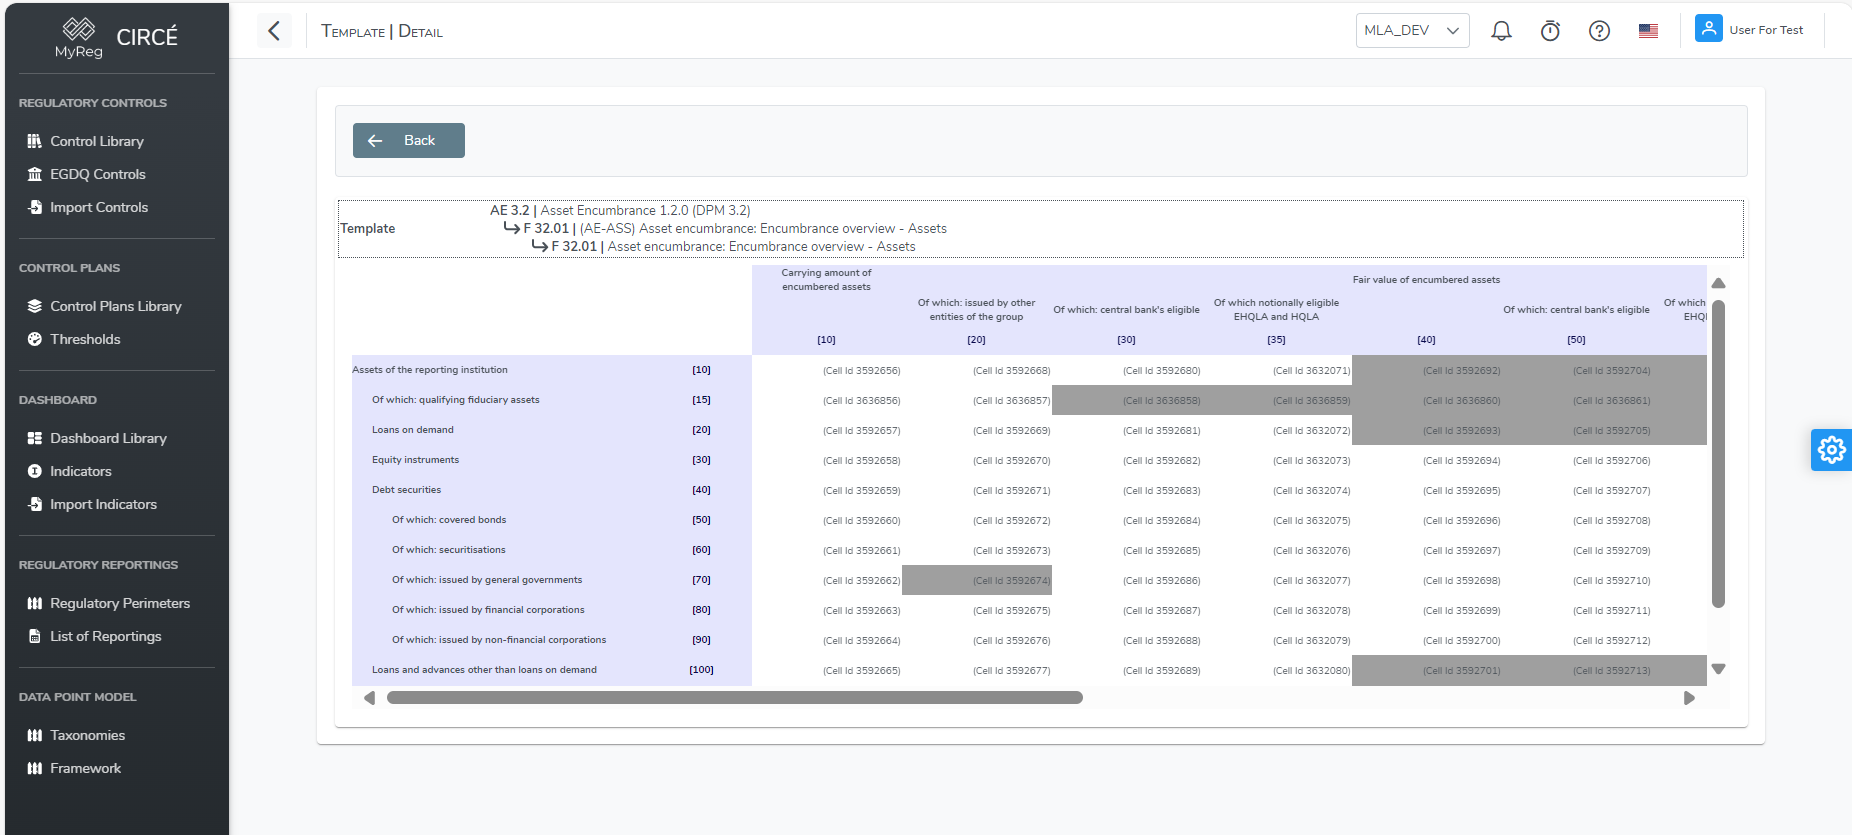
Click a template’s code or label to open its detailed view:
- the header: the table code, the taxonomy and the date, then the table label and, if it differs, the template code and label;
- the template table, with its rows and columns. Column headers are nested and stay visible while scrolling. Codes are the 4-digit EBA codes;
- shaded cells, hatched, as the Not applicable (shaded) legend recalls;
- a Sheet selector when the template has several sheets. When it has a single sheet axis, the selector bears the name of that axis and chooses its member.
Back returns to the list.
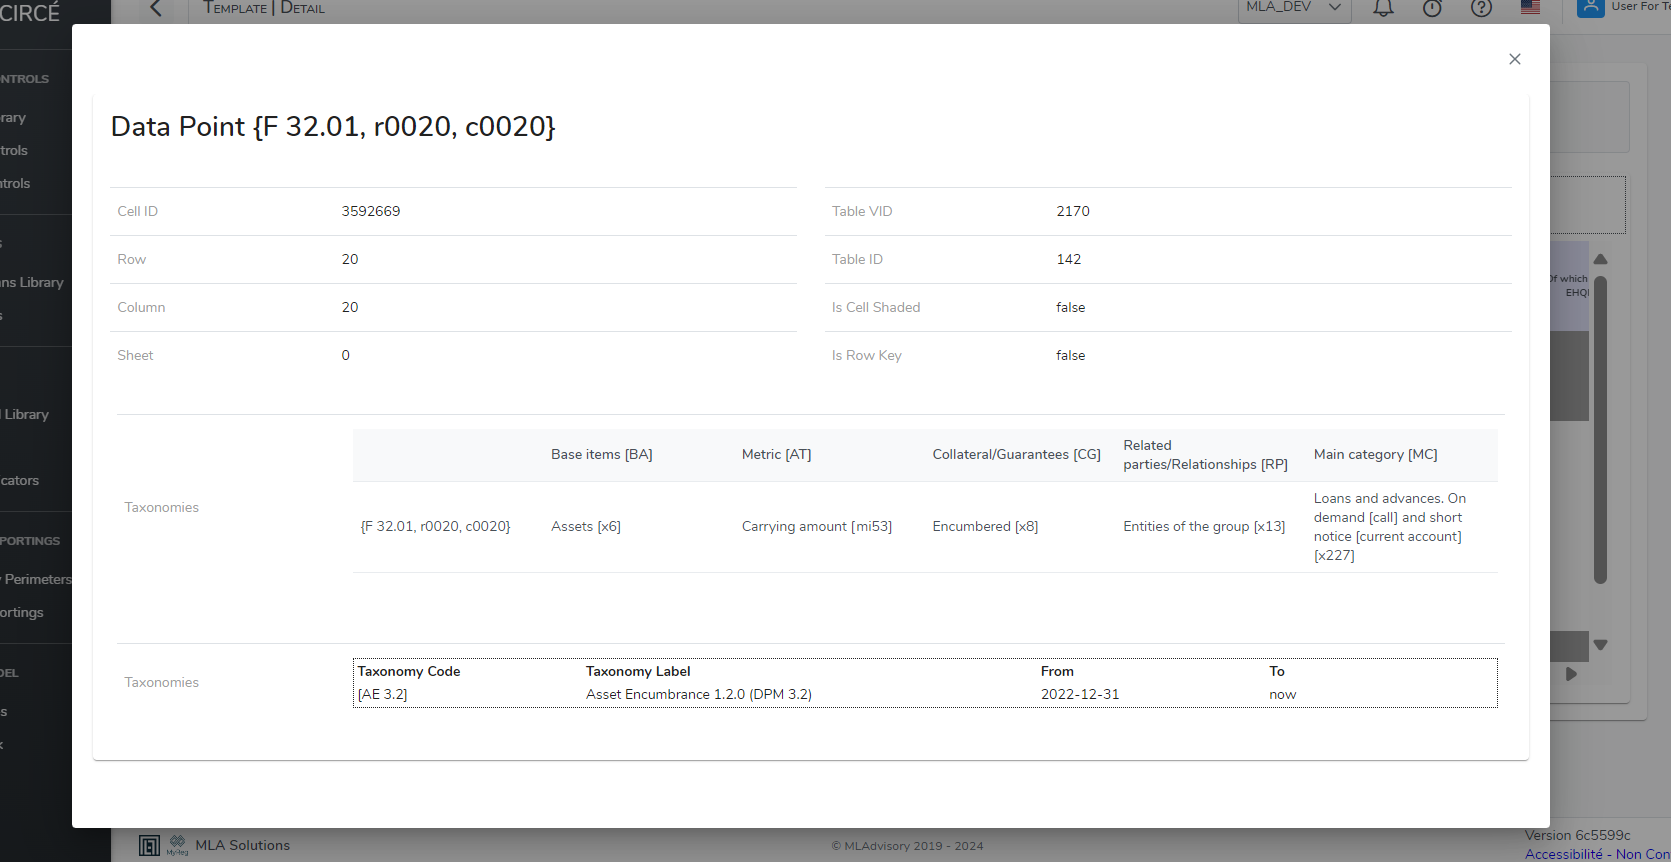
Click a cell to show its details:
- the cell code and, where relevant, the Not applicable (shaded) and Is Row Key marks;
- the row, column and sheet, with their code and label;
- the cell’s Dimensions: for each, the domain and the member;
- the Taxonomies in which the cell exists, with their start and end dates. The taxonomy in force carries the “current” mark;
- at the bottom, the technical identifiers: Cell ID, Table VID and Table ID.
Frameworks
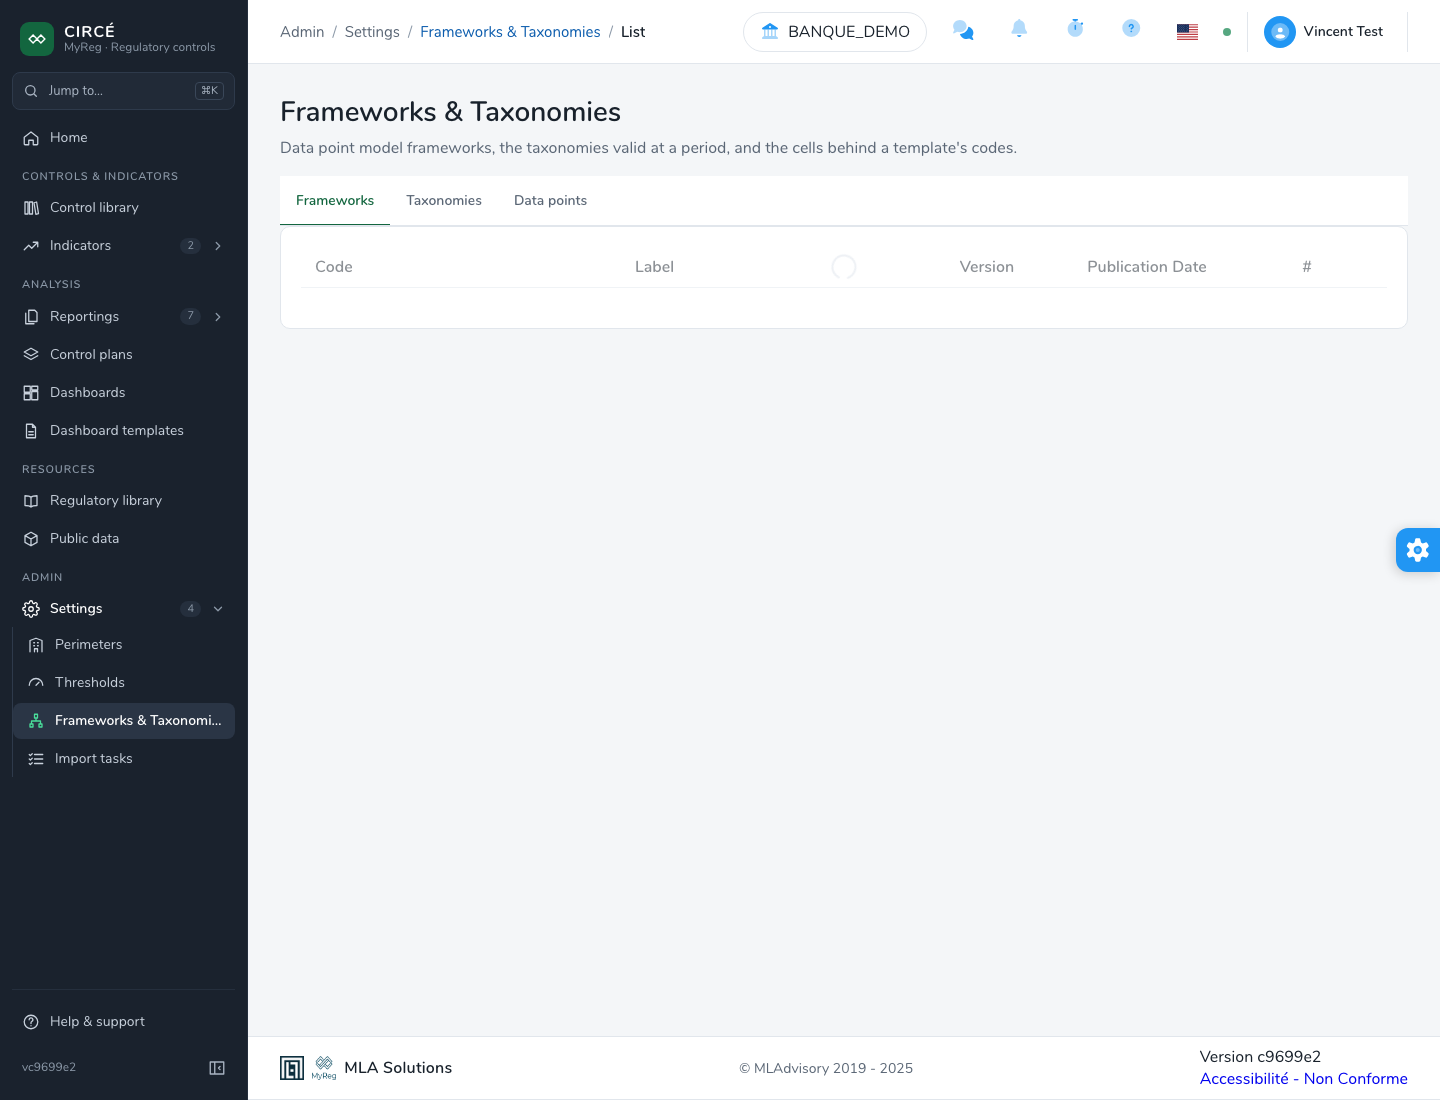
The Frameworks tab shows the reportings supported by the platform, as a tree:
- each framework, for example COREP or FINREP: its code, its label, its DPM package and its number of taxonomies;
- each taxonomy of the framework: its code, its label, its version and its publication date.
This tab is useful for a control valid in a previous taxonomy, if you do not know at what date that taxonomy was in force.
Data points
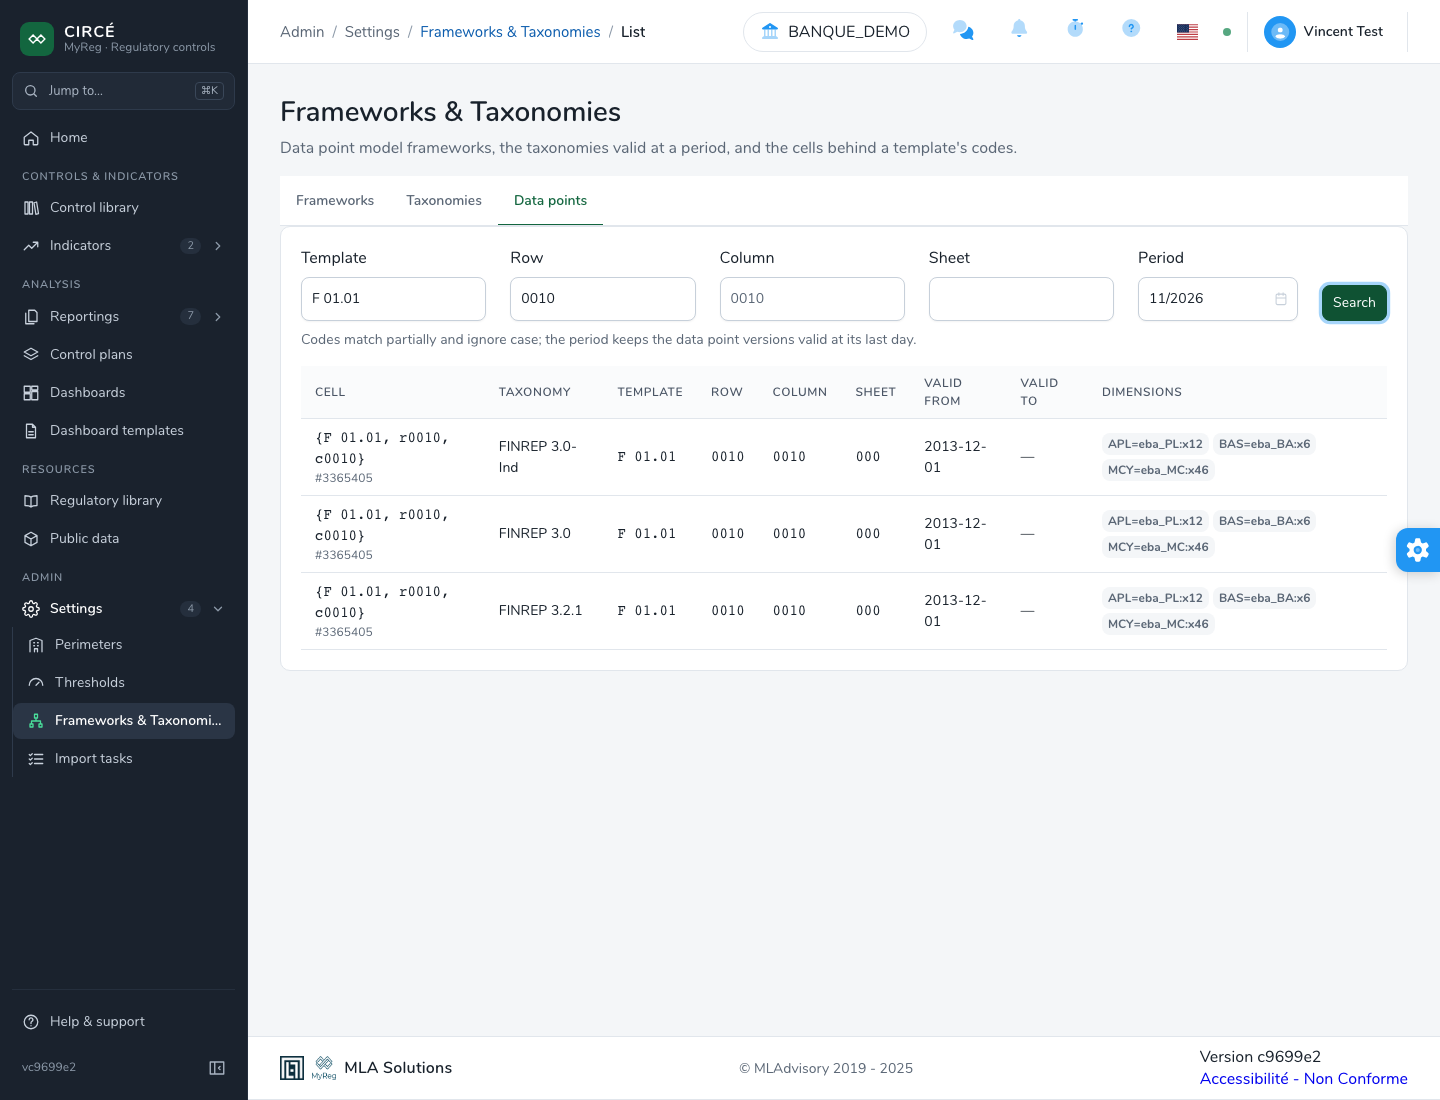
The Data points tab finds the cells of a template from its row, column and sheet codes. It helps, for example, to find the DPM cell of a reported amount, or the taxonomy versions that carry a cell.
- Enter the Template code, for example
F 01.01. It is mandatory. - Optionally, specify the Row, Column and Sheet, for example
0010. - Choose the Period: a month, by default the current month.
- Click Search.
Codes match partially and ignore case. The period keeps the data point versions valid at its last day. After a first search, changing the period runs it again.
The result shows, for each cell:
- the Cell: its code and its identifier;
- the Taxonomy;
- the Template, Row, Column and Sheet;
- its validity dates, Valid from and Valid to;
- its XBRL Dimensions.
Only the first 100 cells are shown. A message then invites you to narrow the row, column or sheet.
Generate an XBRL report
This page appears only if the generate-dpm module is enabled.
The Analysis > Reportings > Generate XBRL page turns a FINREP or COREP Excel workbook, in the EBA template layout, into the XBRL-CSV report package the EBA expects. The package can then be imported as a reporting file, to run the controls on it.
Download a blank workbook
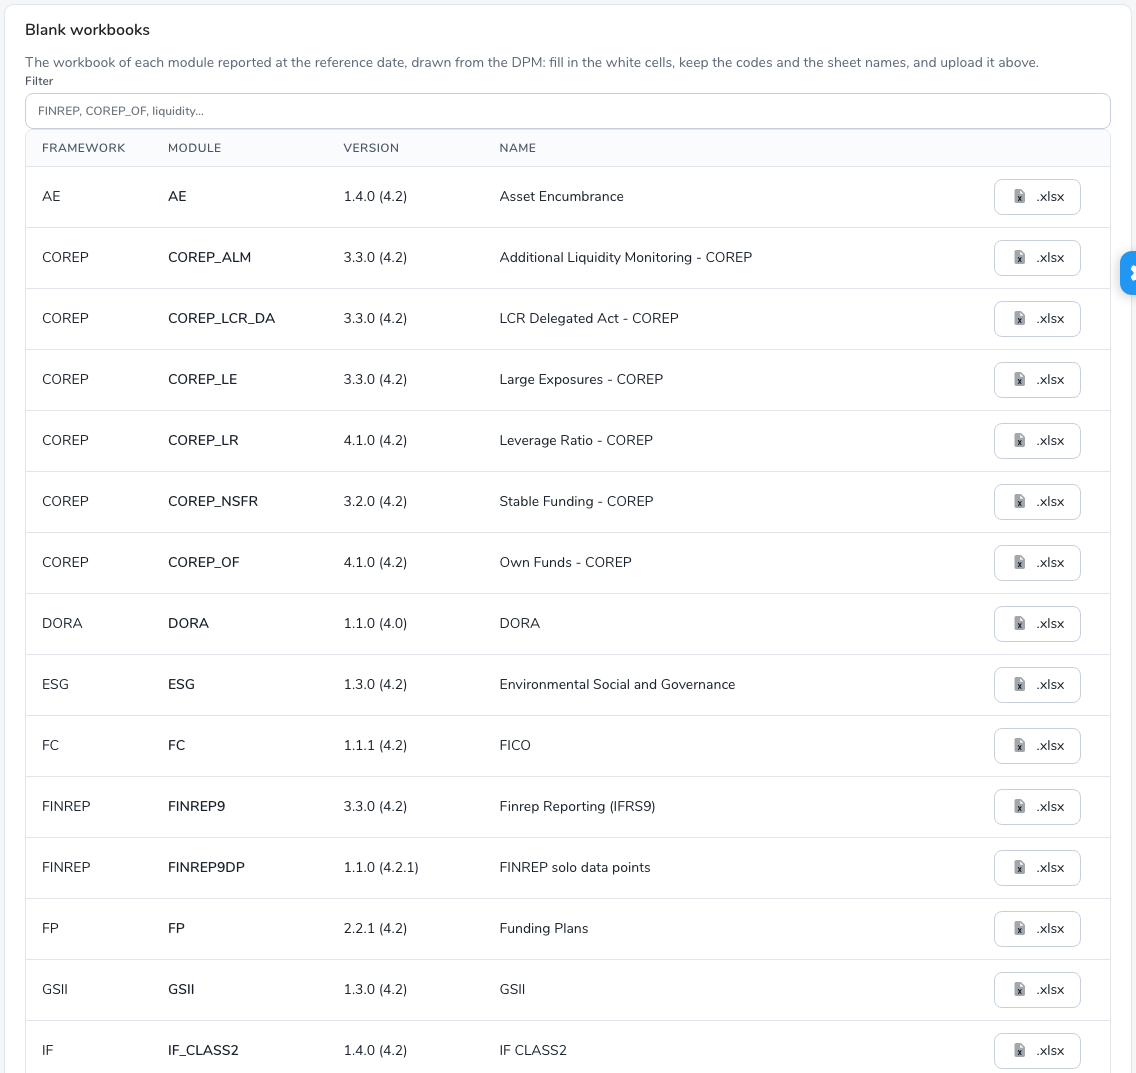
The Blank workbooks section offers the workbook of each module reported at the Reference date chosen in the form. The workbook is drawn from the DPM.
- The Filter field looks for a module, for example FINREP, COREP_OF or a word of the name.
- For each module, the list shows the Framework, the Module, the Version and the Name.
- The .xlsx button downloads the module’s blank workbook.
Fill in the white cells. Keep the codes and the sheet names, then upload the workbook in the form.
The blank workbook follows the layout the generation expects, but it is not identical to the annotated templates published by the EBA: it has no legal reference column and no EBA formatting.
Prepare the workbook
The workbook contains:
- an Index sheet: the module, its version, its release and its entry point, then one line per table with its number (Template number), its code (Template code) and its name;
- one sheet per table, for example
F 18.00.a. Column codes are above the grid, row codes on the left.
In a table sheet:
- white cells are to be filled in, grey cells do not exist in the DPM;
- values follow the DPM type of the cell: number, date, boolean or code. For a value chosen from a list, for example
eba_qCO:qx2000 — LEI code, only the code is read.
Tables with a Z axis (sheets). At the top of the sheet, one “Z axis” line per key lets you choose the member from a drop-down list, for example a currency or a country. To report another member, copy the sheet, for example F 20.04 (2), and choose the member in the copy.
Tables with open rows. The “Open rows” marker flags an open table, for example F 40.01 or C 14.00. Fill in one line per reported row under the codes, starting with the key columns, with a blue header. An enumerated key column offers a drop-down list. You can add lines below the drawn lines.
Generate the package
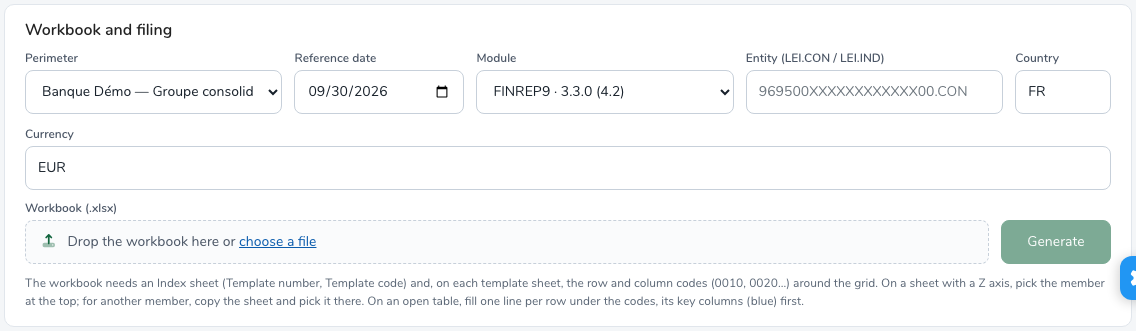
In the Workbook and filing section, fill in:
- the Perimeter;
- the Reference date, by default the last quarter end. The modules offered depend on this date;
- the Module, by default FINREP9 if it is reported at that date;
- the Entity (LEI.CON / LEI.IND);
- the Country, by default FR, and the Currency, by default EUR;
- the Workbook (.xlsx): drop it in the area, or click choose a file.
Click Generate.
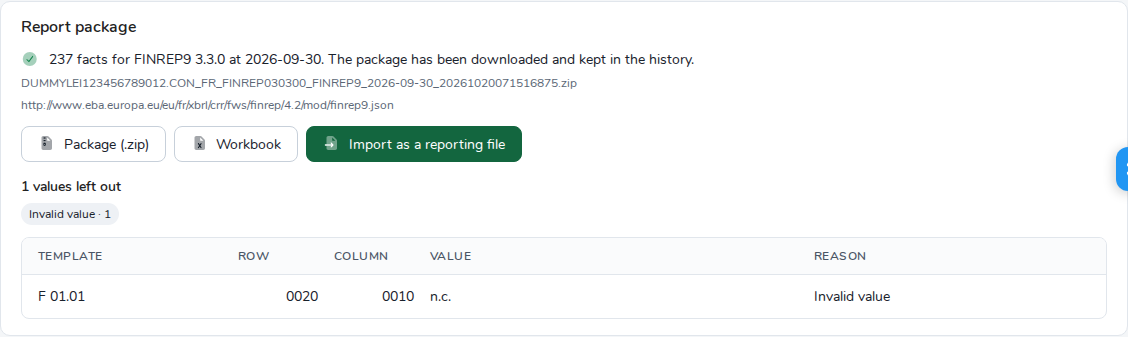
The Report package section shows the result:
- the number of facts produced, for the module, its version and the date. The package is downloaded and kept in the history;
- the Package (.zip) and Workbook buttons, which download the package and the uploaded workbook again;
- Import as a reporting file: the package becomes a reporting file of the perimeter. It is extracted like an upload, and the controls can run on it. Once imported, the Open the reporting file link replaces it. A package can be imported only once.
If no value of the workbook matches a cell of the module, no package is generated. The same workbook cannot be generated twice.
Values left out
Under the result, “N values left out” lists each value the generation did not take, with its template, row, column, value and Reason. A value left out on an open row has no row code: it shows “—”. Chips count the values per reason. Hover over a chip to read the explanation of the reason. The list shows the first 200 values, then “And N more”.
| Reason | Meaning |
|---|---|
| Template not in the module | The sheet’s template is not one of the module’s templates at this date. |
| Unknown cell | No cell of the template has this row and column. |
| Ambiguous cell | Several datapoints answer this row and column in the template. |
| Invalid value | The value cannot have the cell’s type: text in an amount, a decimal in an integer… |
| Conflicting value | The same datapoint is already reported with another value in the workbook. |
| Z axis member not chosen | The cell lies on a sheet (Z) axis and its sheet names no member: pick one in the Z axis row at the top of the sheet. |
| Z axis member unknown | The member picked on the sheet is not one of the axis’s: choose one from the list. |
| Row key missing | The value is on a line of an open table whose key column is empty: fill the blue columns of the line. |
| Row key unknown | A key column of the line holds a value its key does not accept: choose a code from its list, or type a value of its kind. |
The “Sheet axis (not read then)” reason appears only for old generations, made before sheet (Z) axes were read. Generate the workbook again to include these values.
The generation history
The Generations section keeps each generation. For each one, it shows:
- the date and author of the generation;
- the Perimeter;
- the Filing: the module, its version, the reference date and the entity;
- the uploaded Workbook;
- the number of Facts, with the number of values left out and the Imported mark if the package was imported.
The actions of each generation are Show the details, which shows its Report package again, Package (.zip) and Delete. Deletion removes the generation, its workbook and its package, after confirmation. A reporting file imported from this generation is kept.

FINREP from BIRD
This page appears only if the bird module is enabled.
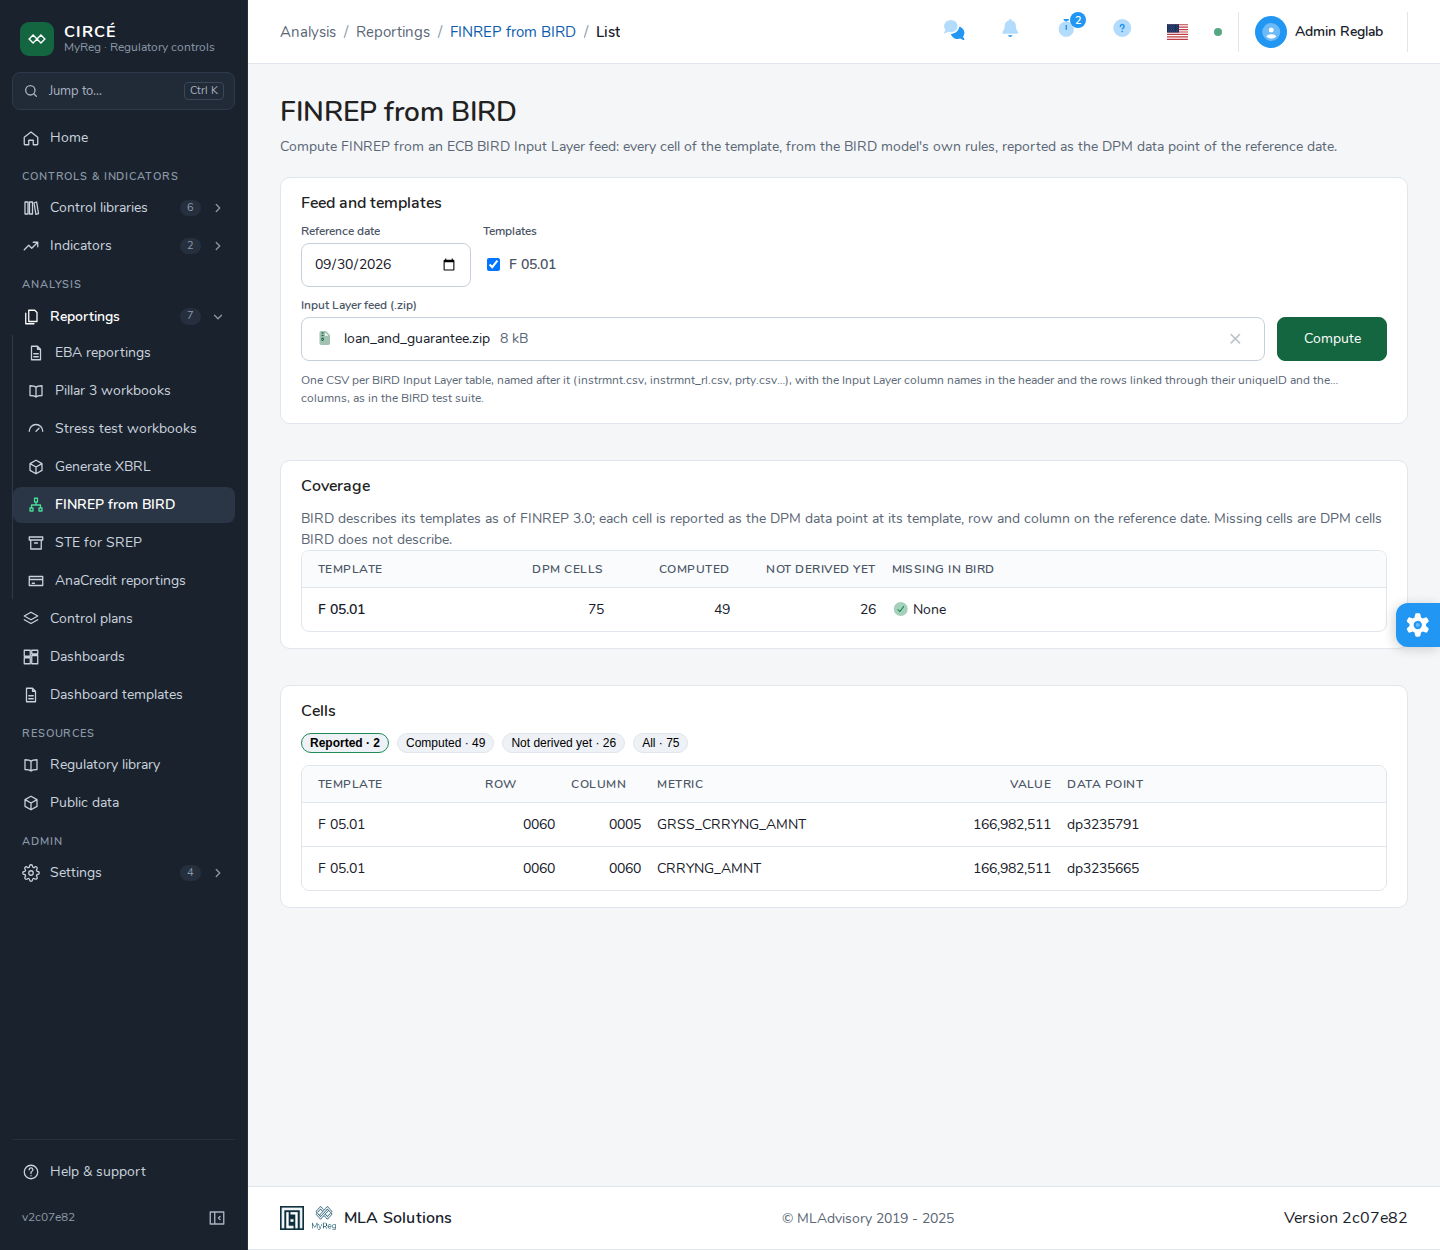
The Analysis > Reportings > FINREP from BIRD page computes FINREP from an ECB BIRD Input Layer feed. Each cell of the template is computed from the BIRD model’s own rules, then reported as the DPM data point of the reference date. Nothing is stored: the result is only shown on screen.
The computation currently covers the F 05.01 template. Debt securities are not supported yet.
Run a computation
In the Feed and templates section, fill in:
- the Reference date;
- the Templates to compute, among those the platform can compute;
- the Input Layer feed (.zip): drop it in the area, or click choose a file.
The archive contains one CSV file per BIRD Input Layer table, named after it (instrmnt.csv, instrmnt_rl.csv, prty.csv…). Each CSV has the Input Layer column names in its header, and its rows are linked through their identifier, as in the BIRD test suite.
Click Compute.
Read the result
The Coverage section shows, for each template:
- the number of DPM cells;
- the number of Computed cells;
- the number of cells Not derived yet;
- the cells Missing in BIRD, that is, the DPM cells BIRD does not describe, or “None”.
BIRD describes its templates as of FINREP 3.0: each cell is reported as the DPM data point of its template, row and column on the reference date. A message flags the computed cells that have no DPM data point at that date.
The Cells section lists the cells, with their template, row, column, metric, value and data point. Hover over a value to see the number of Input Layer rows that contribute to it. Chips filter the list, with the number of cells of each:
- Reported: the computed cells whose value is not zero;
- Computed;
- Not derived yet;
- All.