Pillar 3
This chapter only applies to installations where the optional Pillar 3 module (pilar3) is enabled for your organisation. Otherwise, the Pillar 3 workbooks menu entry and the Generate Pillar 3 action do not appear.
The peer comparisons also need the Public data module: see Public data.
The module produces the EBA Pillar 3 disclosure workbook (EBA mapping tool 1.5, framework 4.2) from your reportings already loaded: COREP, FINREP, LCR, NSFR, leverage, asset encumbrance, MREL/TLAC, remuneration…
- The workbook keeps the formatting of the 80 EBA templates.
- A cell the reportings cannot compute stays empty: never an invented 0, never the text of the rule.
- Every cell is traced: its rule, the resolved formula, the source facts and their file.
The pages are under Analysis › Reportings › Pillar 3 workbooks.
Video tutorials
Three tutorials, in French with French subtitles, follow the module from start to finish.
Producing the workbook (5 min 37)
Reference date and perimeter, reportings used, templates to fill, generation, then a cell-by-cell review with the source of each figure.
Completing the workbook by hand (4 min 14)
Manual values, entry in the sheet, forced value, a cell followed from one template to another, draft.
Comparing yourself (3 min 08)
EBA risk indicators, EBA transparency exercise and EBA stress test.
Rights
| Action | Right needed |
|---|---|
| Generate a workbook | The export right on each source reporting. |
| View the manual values, the history, the detail of a workbook, a sheet | The read right on the perimeter. |
| Enter or delete a manual value, save or delete a draft, delete a workbook | The edit right on the perimeter. |
How to generate a Pillar 3 workbook
There are two entry points:
- in Analysis › Reportings › EBA reportings, check reportings, then click Generate Pillar 3 in the action bar. The reportings must be processed DPM (XBRL) reportings of a single perimeter;
- in Pillar 3 workbooks, click Generate Pillar 3.
The Generate Pillar 3 page opens. Its header has three settings:
- Perimeter: the table fills from this perimeter’s reportings;
- Reference date (T): change it with the Earlier reference date and Later reference date arrows, one frequency step at a time. By default, it is the latest date of the selected reportings. T must be a month end;
- Disclosure frequency: Quarterly (default), Semi-annual or Annual. It sets the T-1 to T-4 dates the templates read.
The page has two tabs: Reportings and Templates to fill.
Disclosure choices of the institution
Under these settings, the Disclosure choices of the institution row holds three lists. Each offers “not given” and two values:
| Choice | Values | Templates concerned |
|---|---|---|
| Leverage ratio Tier 1 (Art. 499(2) CRR) | Fully phased in or Transitional | The leverage ratio rows of EU KM1 |
| Institution (Art. 433a CRR, EU CCR7) | G-SII or listed or Other large institution | EU CCR7 |
| Trading book boundary (Art. 314(6) CRR, EU OR2) | Accounting or Prudential (PBA) | EU OR2 |
- The choices are sent with the coverage check, the sheet entry and the generation. Changing a choice recomputes the coverage.
- They are saved with the draft and restored when it is resumed. Without a draft, they are prefilled with those of the perimeter’s last generation.
- Cells that depend on a choice not given stay empty.

The Reportings tab
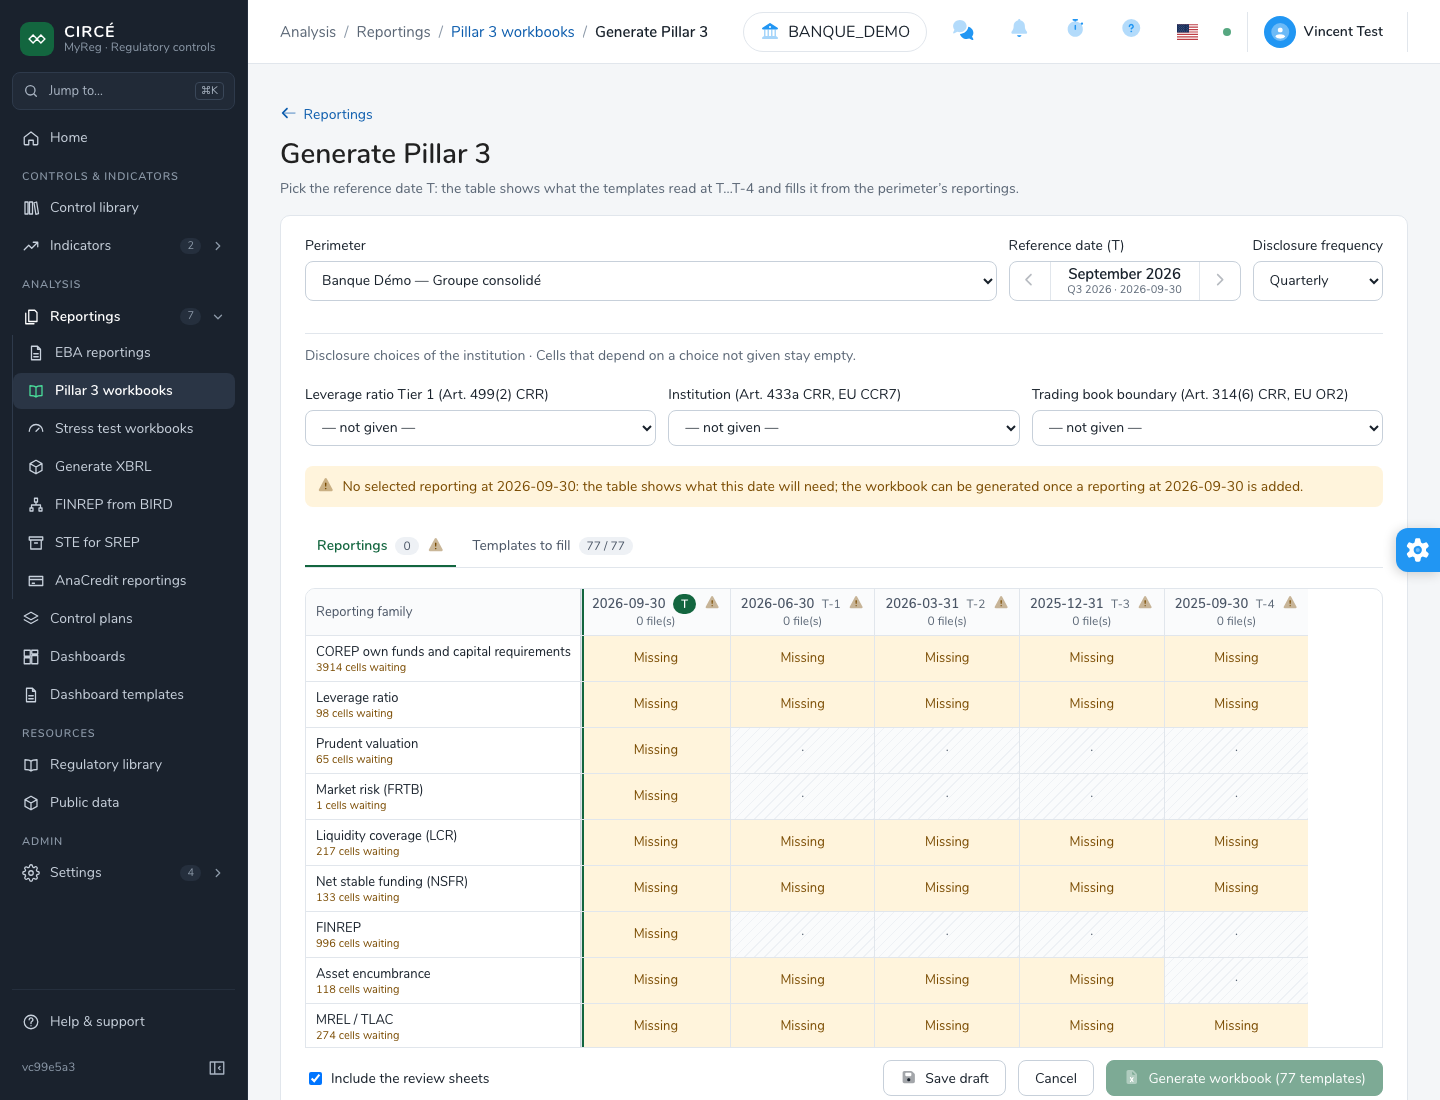
The table crosses the reporting families (rows) and the reporting dates from T to T-4 (columns). It fills automatically from the perimeter’s reportings: when a single reporting fits a cell, it is added automatically.
The families are: COREP own funds and capital requirements, Prudent valuation, Leverage ratio, Liquidity coverage (LCR), Net stable funding (NSFR), Market risk (FRTB), FINREP, Asset encumbrance, MREL / TLAC, Remuneration and Other reportings.
Each cell shows its state:
| Cell | Meaning |
|---|---|
| Selected (✓) | A reporting is kept. The cross removes it from the selection. |
| Add | A reporting of the perimeter is available but not selected. |
| Choose (n) | Several reportings carry the same tables at this date: choose the one to keep or to add. |
| Missing | No reporting, although the templates need one. |
| Hatched | The date is not read for this family and this T. |
- For a missing family, the row shows the number of cells waiting. Hovering gives the tables read and the templates concerned.
- A warning icon on the tab means that some reportings the templates need are missing.
- The 12-month averages (EU LIQ1) also read the month ends between these dates: a line shows how many the selection covers.
- Selected reportings that are not read for this T are flagged. The Remove them link removes them.
- As long as several selected reportings carry the same tables at the same date, generation is blocked: choose one in the marked cells.
If no reporting is selected at date T, the table shows what this date will need. You can thus prepare the next quarter. The workbook can only be generated once a reporting at date T is added.
The Templates to fill tab
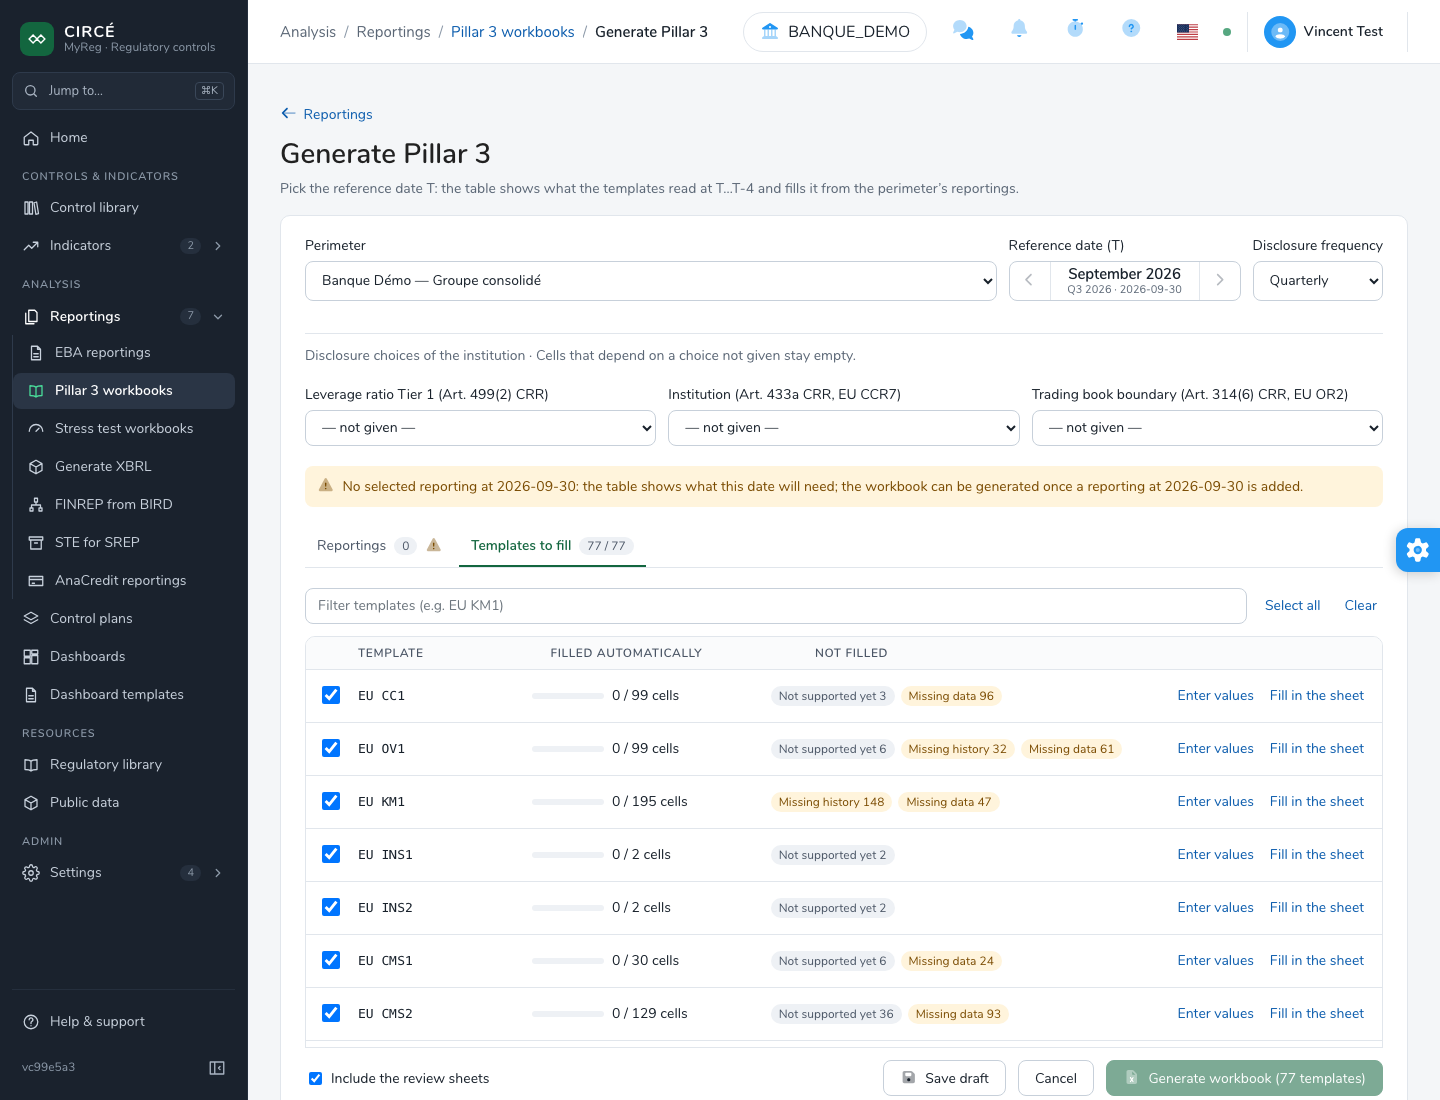
The tab shows, template by template, what the selected reportings can fill:
- Filled automatically: the number of cells filled out of the number of applicable cells;
- Not filled: the empty cells, grouped by cause.
The causes are the following (hovering a chip explains it):
| Cause | Meaning |
|---|---|
| Missing data | A source value is not in the selected reportings. |
| Missing history | A previous date needed by the template has no selected reporting. There is never a partial average or median. |
| Ambiguous | Several selected reportings report the same value. The application never picks one at random. |
| Not supported yet | The mapping rule is not automated yet or waits for validation. |
| Calculation error | The calculation failed, for instance a division by zero or two currencies mixed. |
A cell can also be Entered by hand (manual value), From the reporting, Calculated or Not applicable.
- Check the templates to generate. The “Filter templates (e.g. EU KM1)” field, Select all and Clear help with the selection. With no selection, all templates are generated.
- The total gives the coverage of the selected templates. The Partial workbook mention appears when empty cells remain.
- The Enter values and Fill in the sheet buttons complete a template: see Manual values.
Generate and download
The footer holds:
- Include the review sheets, checked by default: see The content of the workbook;
- Save draft: see The draft;
- Cancel;
- Generate workbook (n templates).
The workbook is downloaded as soon as it is ready. A message says whether it is complete or partial: in the latter case, the empty cells are listed with their cause in the P3 Journal sheet. The See all generated workbooks link opens the history.
Generation is refused in the following cases:
- reportings of different perimeters or entities. Consolidated (
LEI.CON) and individual (LEI.IND) count as different entities; - a file not processed yet, or whose extraction is not finished;
- no reporting at date T;
- a date T that is not a month end.
Taxonomy versions. At date T, reportings must be in 4.2 or in a later release read as 4.2 (4.2.1, 4.2.1.1, 4.2.1.2, 4.3). At earlier dates (T-1 to T-4, averages and medians), 4.0 and 4.1 are also accepted. 3.2 is always refused.
A refused file feeds no cell, and the refusal is reported. A file loaded before filing information (entity, version, module, currency) was kept must be reprocessed.
The content of the workbook
The file is named pillar3_<perimeter>_<T>_<timestamp>.xlsx, with the _partial suffix when it is partial.
With Include the review sheets, three sheets follow the templates:
- P3 Issues: coverage by template, warnings, missing source data with the number of cells they leave empty, the list of empty cells and the forced values. Each message has a severity:
- BLOCKING: a reporting family is missing;
- WARNING: selection diagnostics, rules awaiting validation, manual values ignored;
- INFO: corrected expressions, forced values.
- P3 Metadata: the perimeter, date T, versions, author, sources, dates read and fill rate.
- P3 Journal: for each cell, its status, value, rule, resolved formula, causes, decisions and source facts with their file.
Unchecked, the option produces the templates alone, as published (file ending in _templates.xlsx). The workbook kept in the history always has the three review sheets.
How reportings are read
- The T-1 to T-4 columns read the actual previous dates according to the frequency (3, 6 or 12 months).
- EU LIQ1 computes averages over 12 month ends. EU AE1 to AE3 compute medians over 4 quarters.
- A reference to a table, for instance
C 72.00, covers all its variants. If several facts remain, the variant without breakdown (the all-currencies total) is kept. A full variant code, for instanceC 72.00.w, reads only that variant. - A line left blank in a filed table reads as 0, if it is an existing, non-excluded cell. The journal records it.
- Cells that read the FRTB tables C 91.01, C 95.00, C 96.02 and C 96.03, which do not exist in 4.2, are entered manually (EU MR2, EU MR1, EU OV1, EU CMS1).
Manual values
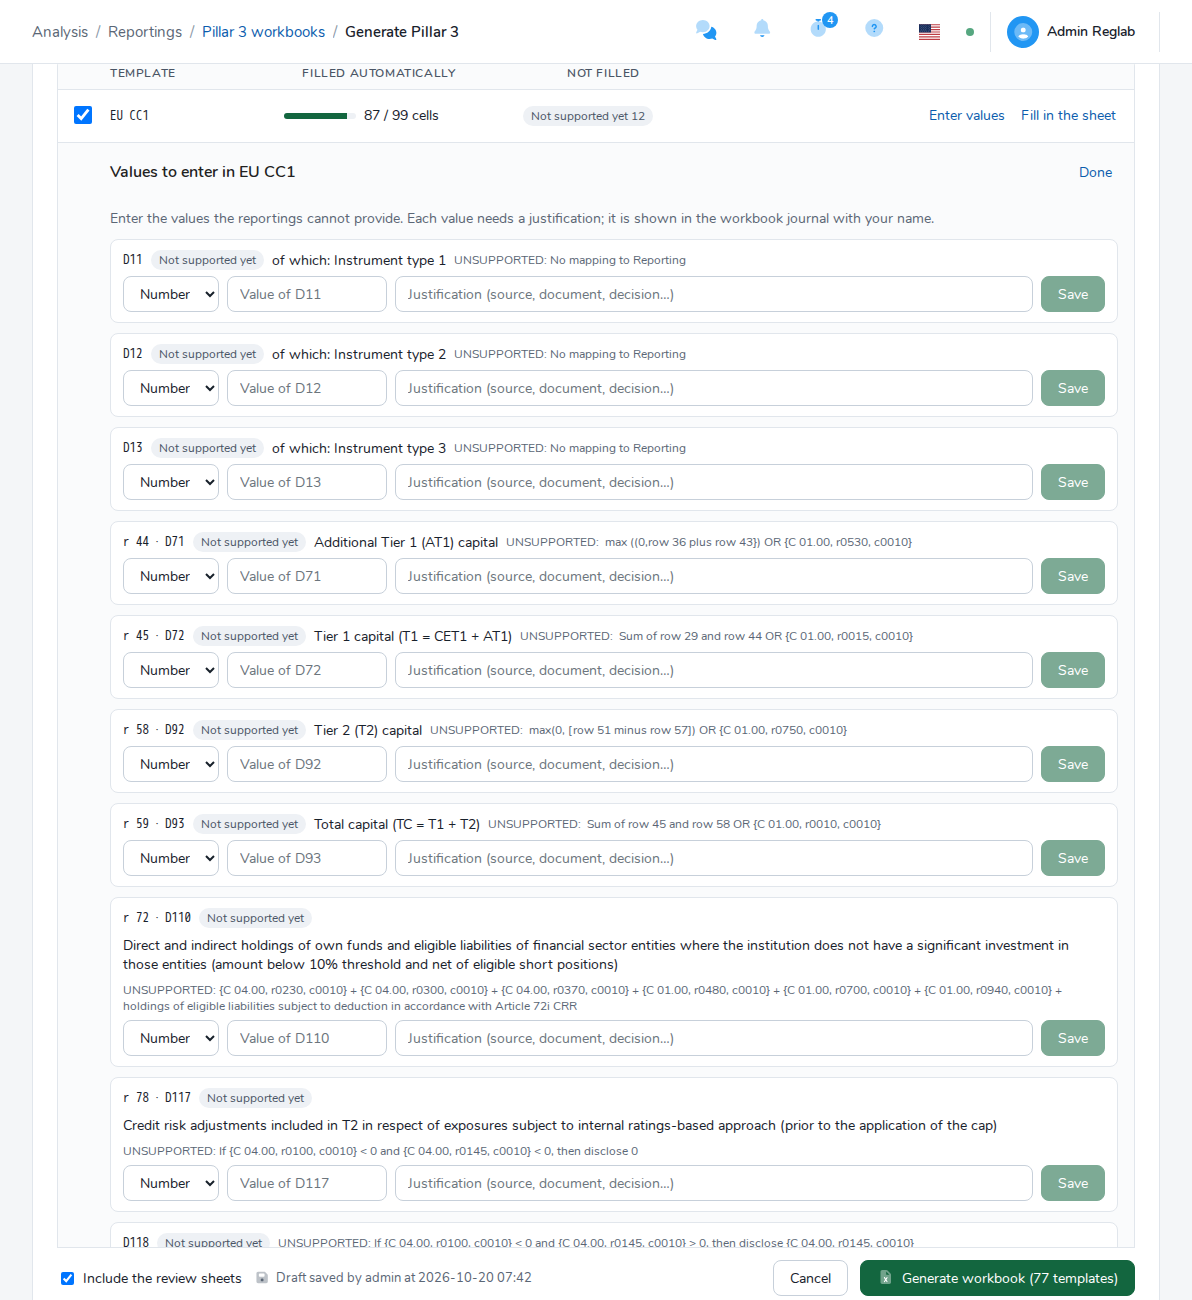
Cells the reportings cannot feed (qualitative information, “No mapping”, remuneration…) are entered by hand. Each value needs a justification; it is shown in the workbook journal with your name.
Manual values belong to a perimeter, a date T and a mapping tool version. They are kept from one generation to the next.
Enter values cell by cell
In the Templates to fill tab, click Enter values on a template’s row. The Values to enter in … panel lists its empty cells.
For each cell:
- Choose the Kind of value: Number or Text. The decimal separator is the point:
12,5is refused. - Type the value and the Justification (source, document, decision…), which is required.
- Click Save. Remove deletes a value already entered.
Click Done to close the panel.
An ambiguous cell or a cell in error cannot be edited: fix the source reportings, since a manual value would hide this problem.
Fill in the sheet
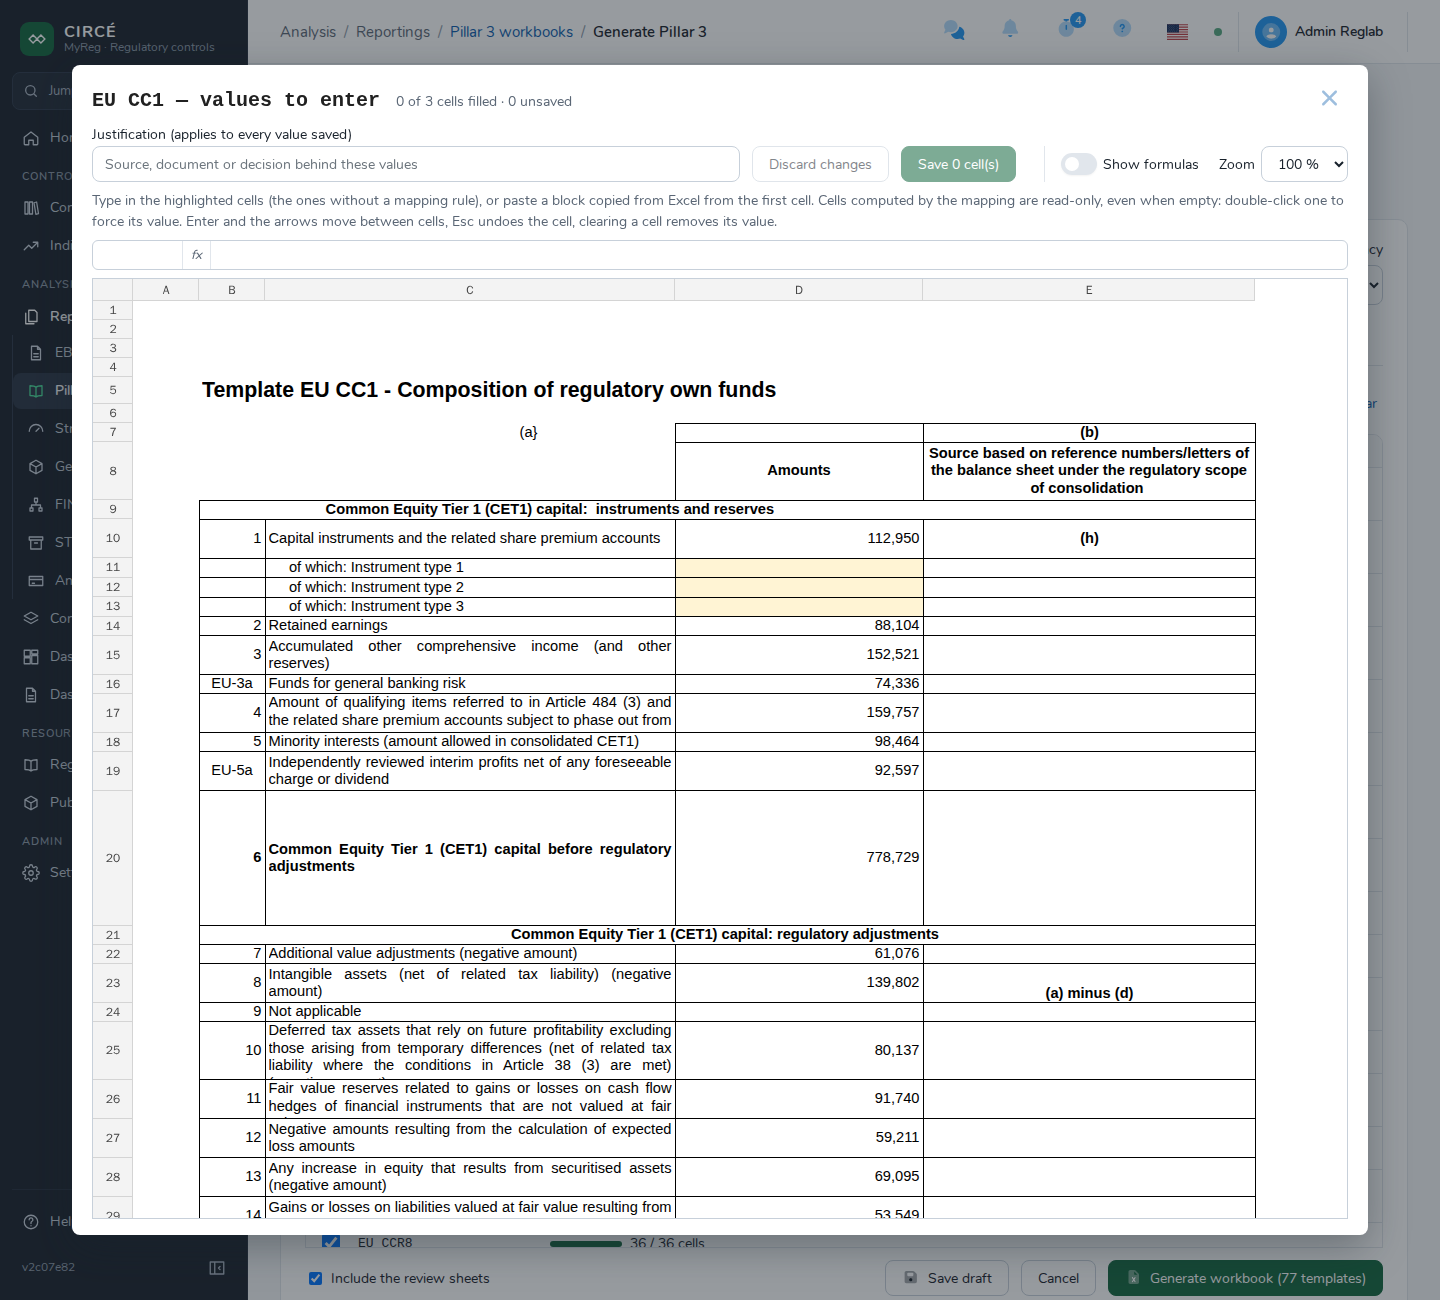
Fill in the sheet opens the template as in Excel.
- The highlighted cells are those without a mapping rule: they are the only ones editable in normal entry.
- You can paste a block copied from Excel from the first cell. Values that fall on non-editable cells are left out and counted.
- Enter and the arrows move between cells, Esc undoes the cell, clearing a cell removes its value.
- Fill in the Justification, which applies to every value saved, then click Save n cell(s). Discard changes drops the entry.
- A single invalid value cancels the whole batch.
- Show formulas (or Ctrl+`) shows the mapping tool’s formula in each cell instead of its value.
- For a selected catalogued cell, the How this cell is computed button of the formula bar opens the same explain dialog as on a generated workbook, computed on the selected reportings (see The detail of a workbook). A cell of the same template followed from this dialog is selected and explained in turn. A cell of another template opens that template in the editor, after a confirmation if typed values are not saved.
Force a calculated value
A cell computed from the reportings is read-only, even when empty. To replace its value:
- Double-click the cell in the grid.
- Confirm with Force the value.
- Type the value and save it with a justification.
The forced value replaces the calculated value, an ambiguity or an error in the workbooks generated for this perimeter at this date. The cells that depend on it are recomputed. The journal keeps the replaced value, your name, the date and the justification, and the P3 Issues sheet lists every override. Clear the cell to get the calculated value back.
Without an override, a manual value only fills an empty cell (Missing data, Missing history, Not supported yet). On a calculated cell, it is ignored and this rejection is reported.
The draft
Save draft keeps the current selection to resume it later or let a colleague take over: the frequency, the reportings kept or set aside, and the templates.
- There is one draft per perimeter, date T and mapping tool version.
- Once saved, every change saves itself. The “Draft saved by … at …” line confirms it.
- When you open a perimeter and date that have a draft, a banner offers Resume the draft.
- If a colleague saved the draft in the meantime, your last changes are not saved. The Load their version button loads theirs.
- A saved reporting that has been deleted or is no longer processed is flagged as unavailable.
- Generating the workbook does not delete the draft.
Generated workbooks
The Pillar 3 workbooks page has two sections.
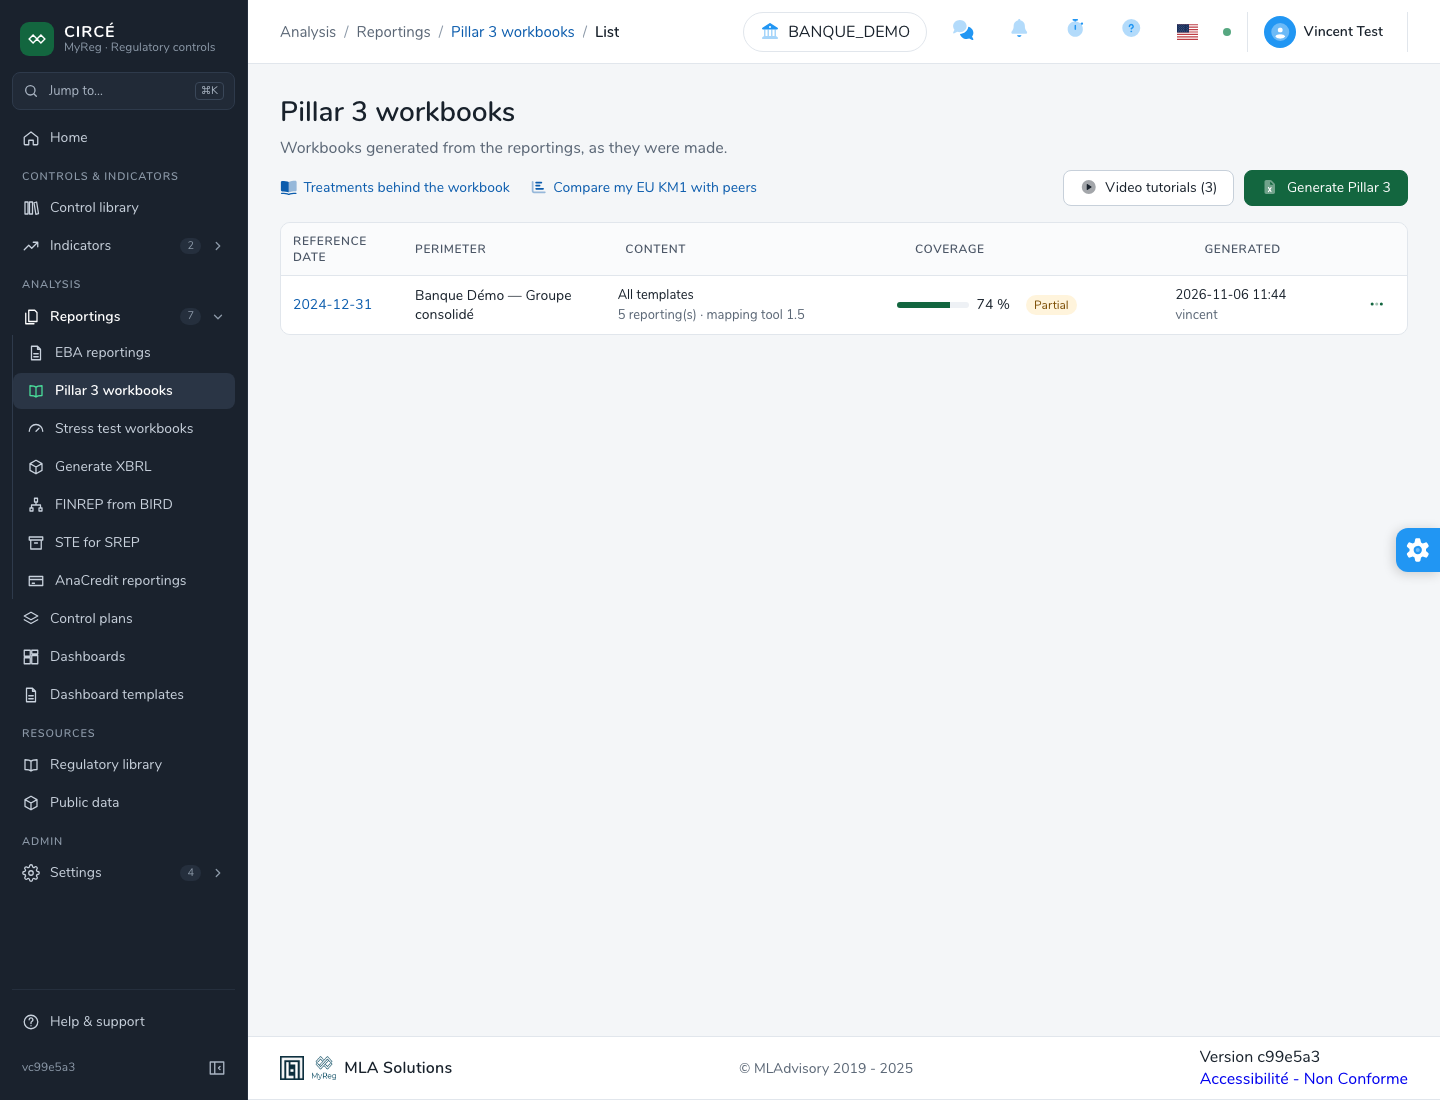
Being prepared lists the drafts, with their reference date, perimeter, content and saving date. Click a draft to resume it; the trash icon deletes it (Delete the draft). Manual values and generated workbooks are kept.
Generated lists the history of workbooks, newest first, for the perimeters you can read:
- Reference date and Perimeter;
- Content: All templates or n templates, the number of reportings and the mapping tool version;
- Coverage: Complete or Partial, with a bar;
- Generated: the date and the author.
The ⋯ menu of a row offers:
- Details;
- Compare KM1 with peers (with the Public data module);
- Download with review sheets;
- Templates only: the filled templates alone, without the review sheets, as they are published;
- Regenerate: generates again with the same selection, today’s data and rules. A new workbook is added;
- Delete: the reportings it was made from are not affected.
Workbooks are kept until they are deleted. The page header also has the Treatments behind the workbook (see Treatments) and Compare my EU KM1 with peers links.
The detail of a workbook
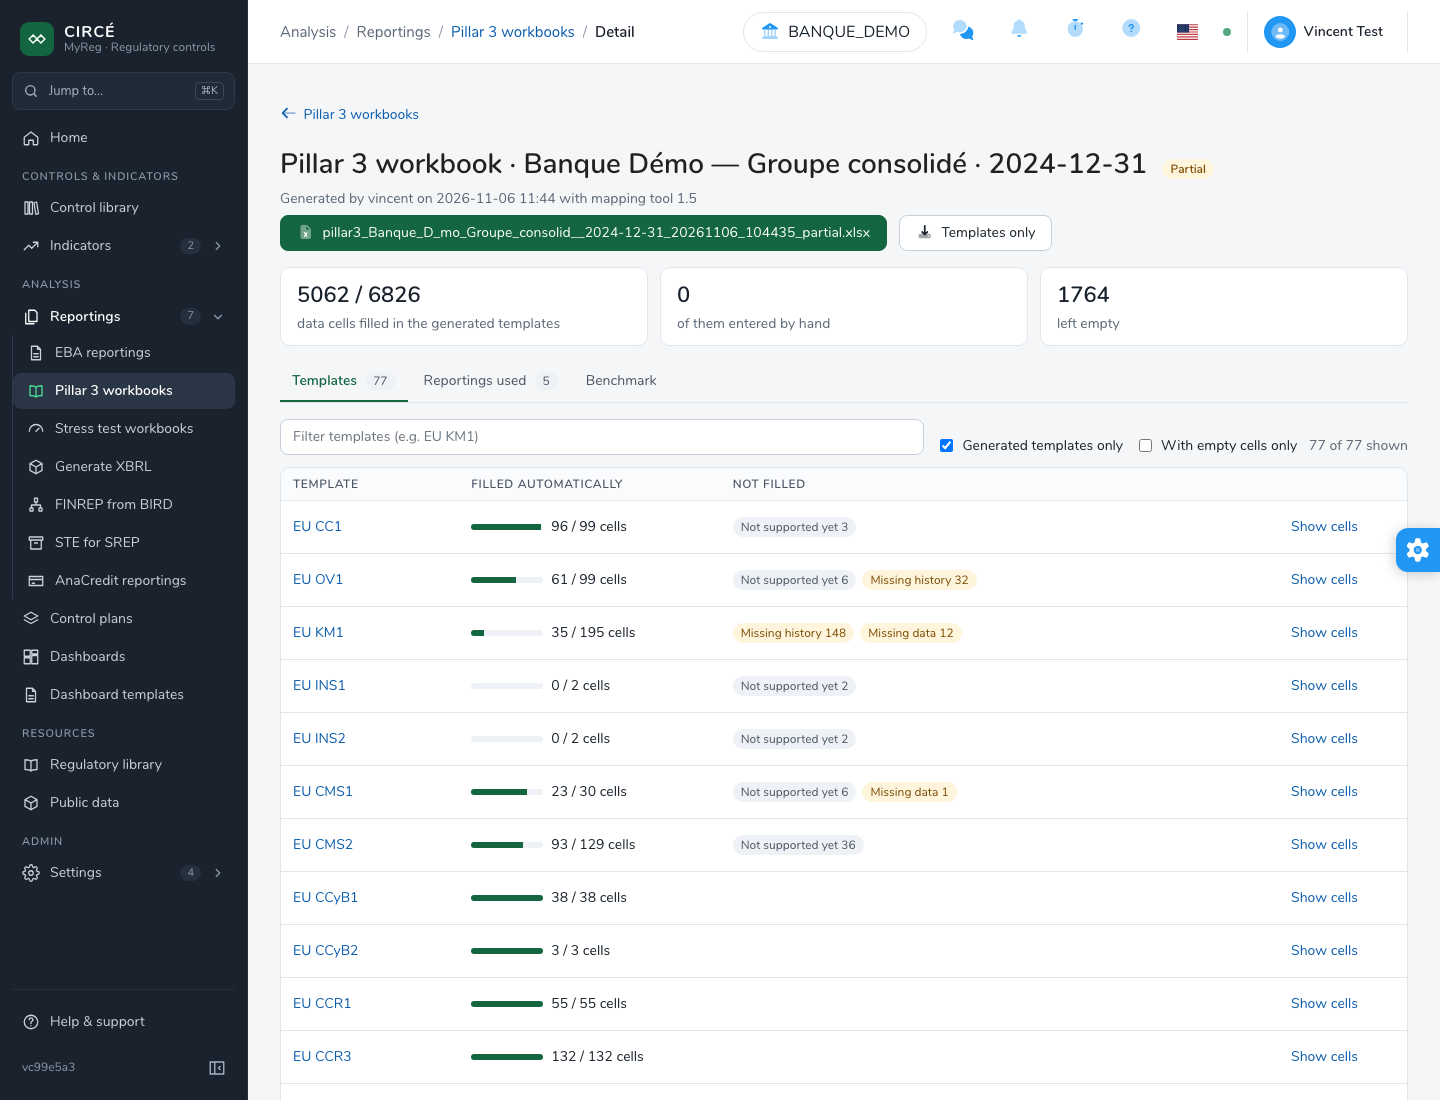
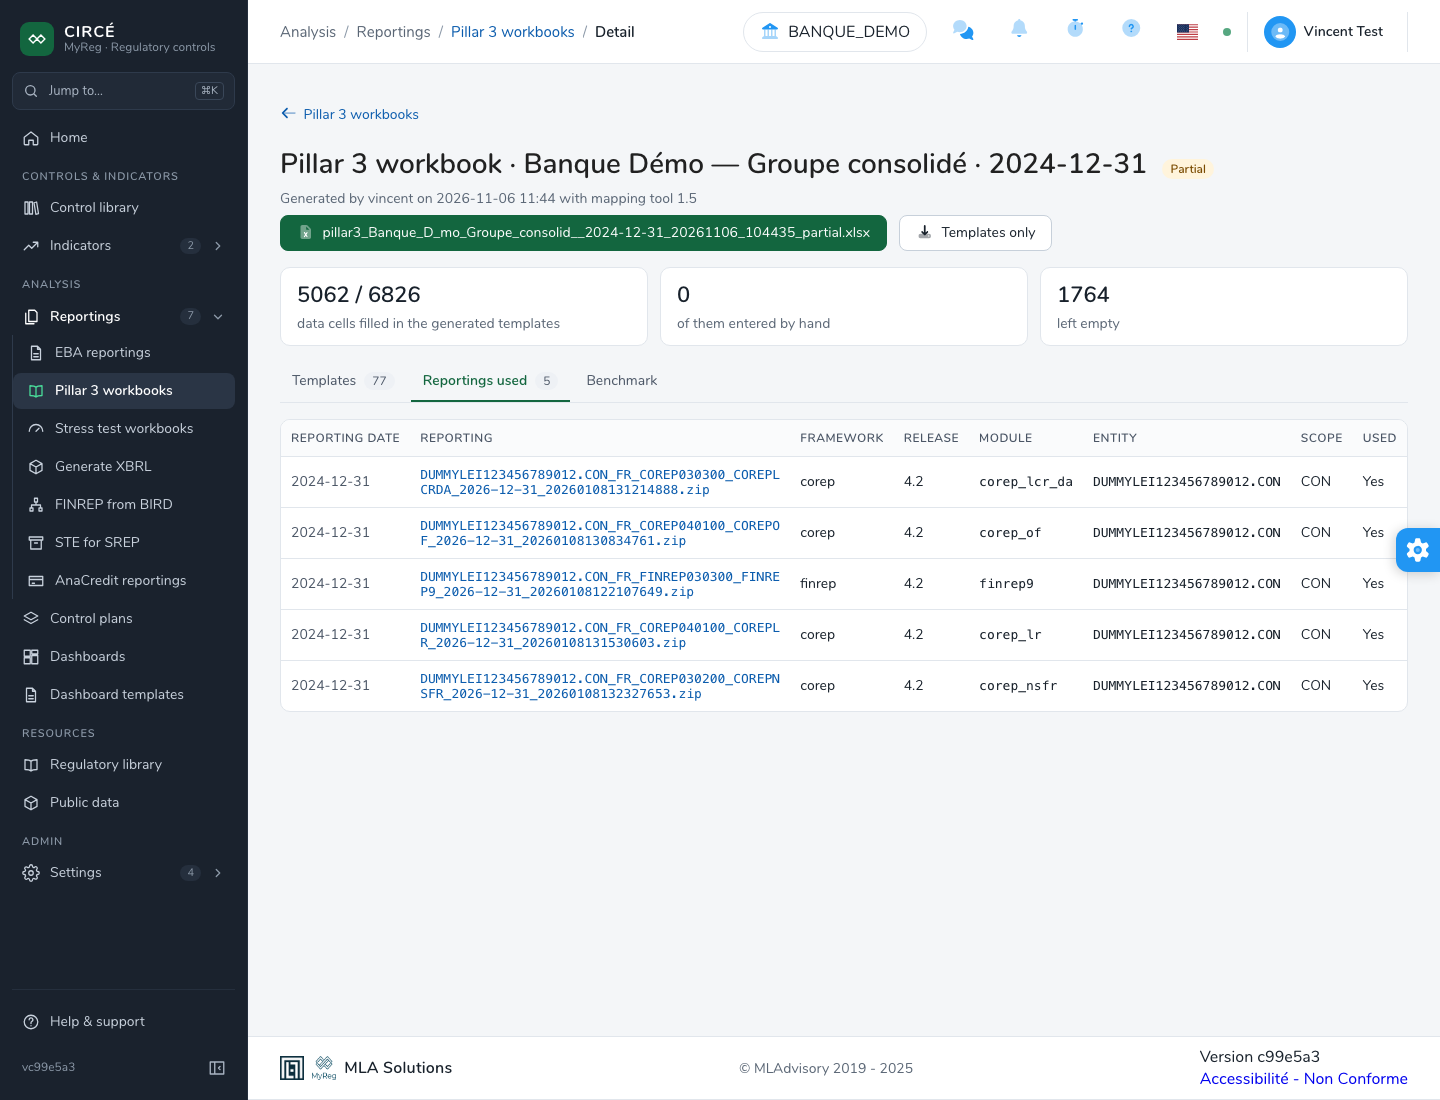
The Pillar 3 workbook · perimeter · date page shows who generated it, when, and with which mapping tool version. It shows the number of data cells filled, of them entered by hand, and left empty, as well as the download buttons.
It has three tabs.
The Templates tab
The tab lists the templates with their filled cells and the causes of the empty cells.
- The filters are “Filter templates”, Generated templates only and With empty cells only.
- Show cells expands the cells of a template; Cells not filled only filters them.
- Each filled value is a link (tooltip “How this cell is computed”). An empty cell keeps the How it was computed link. Both open the cell explain dialog, described below.
- A template’s code opens its sheet.
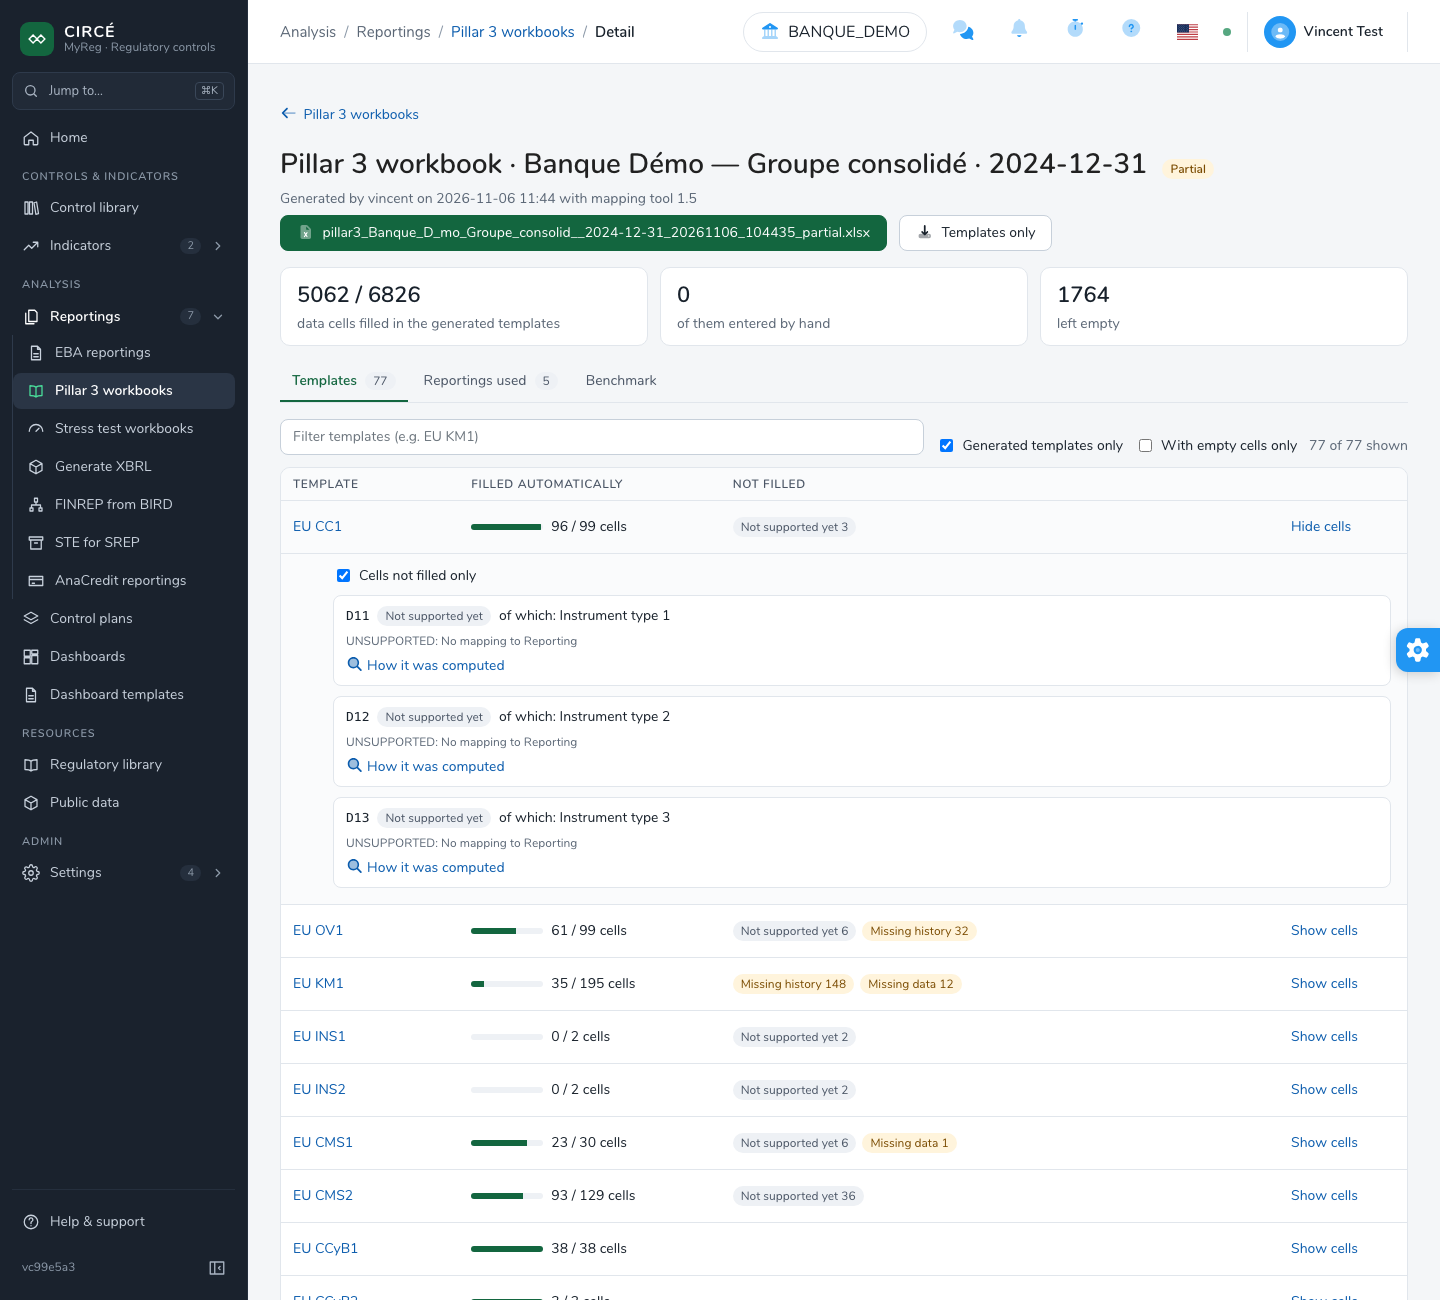
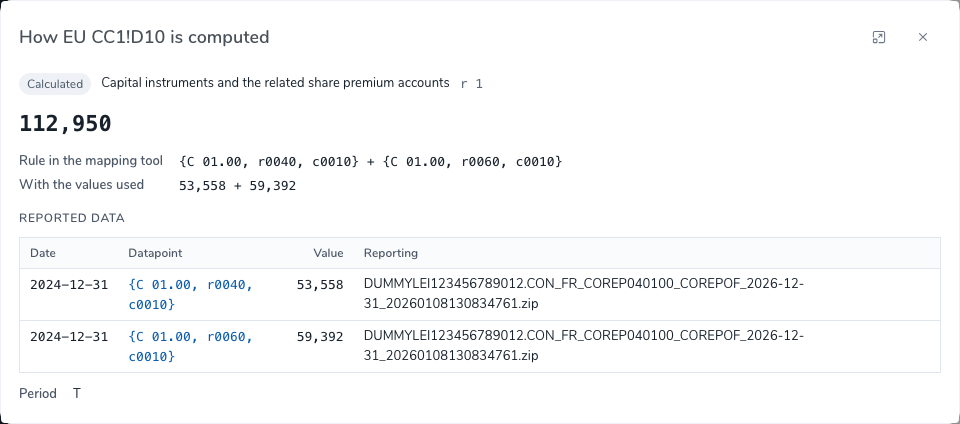
The “How … is computed” dialog opens on a cell, for example “How EU CC1!D10 is computed”. It shows:
- the status of the cell, its row label and its value as the template shows it;
- the Rule in the mapping tool, any Correction or validation and the formula With the values used; for an empty cell, the Why;
- Pillar 3 cells it reads: the cells of the workbook the rule reads, for example
EU KM1!D40. Each opens its own explain, on this template or on another one; - Reported data: for each fact read, its date, its datapoint as the rule writes it, its value and its reporting. The datapoint is a link, “Open the reported template, the cell highlighted”: it opens the template of that reporting with the cell framed (see Open a datapoint in its template);
- the Decisions and the Period.
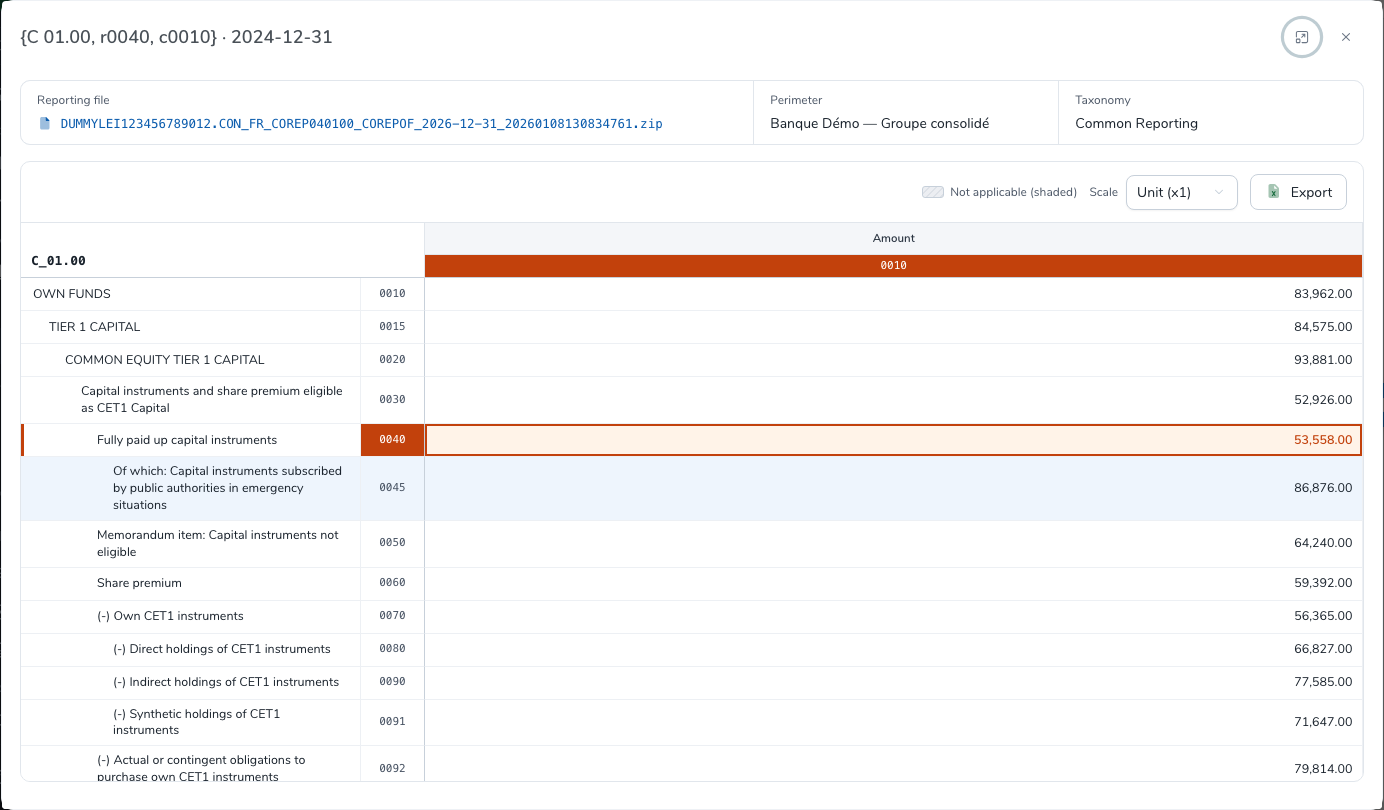
A workbook generated before the sources were recorded shows its source facts as text, without links, with the note “This workbook was generated before the sources were recorded: generate it again to open each reported datapoint.”
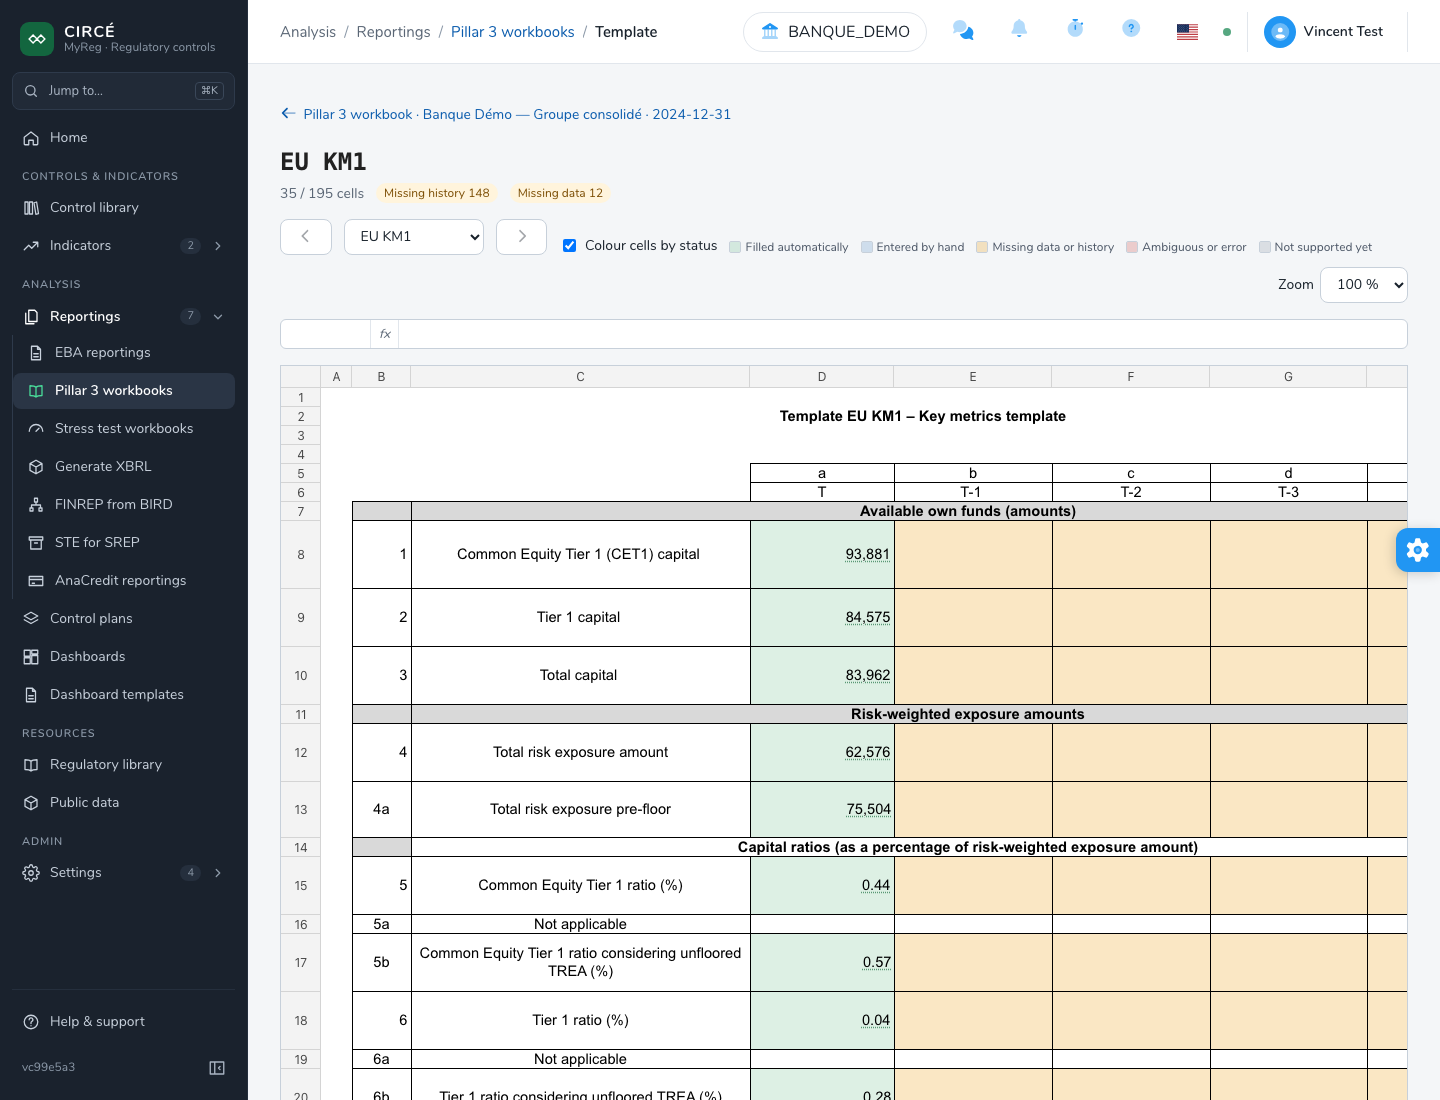
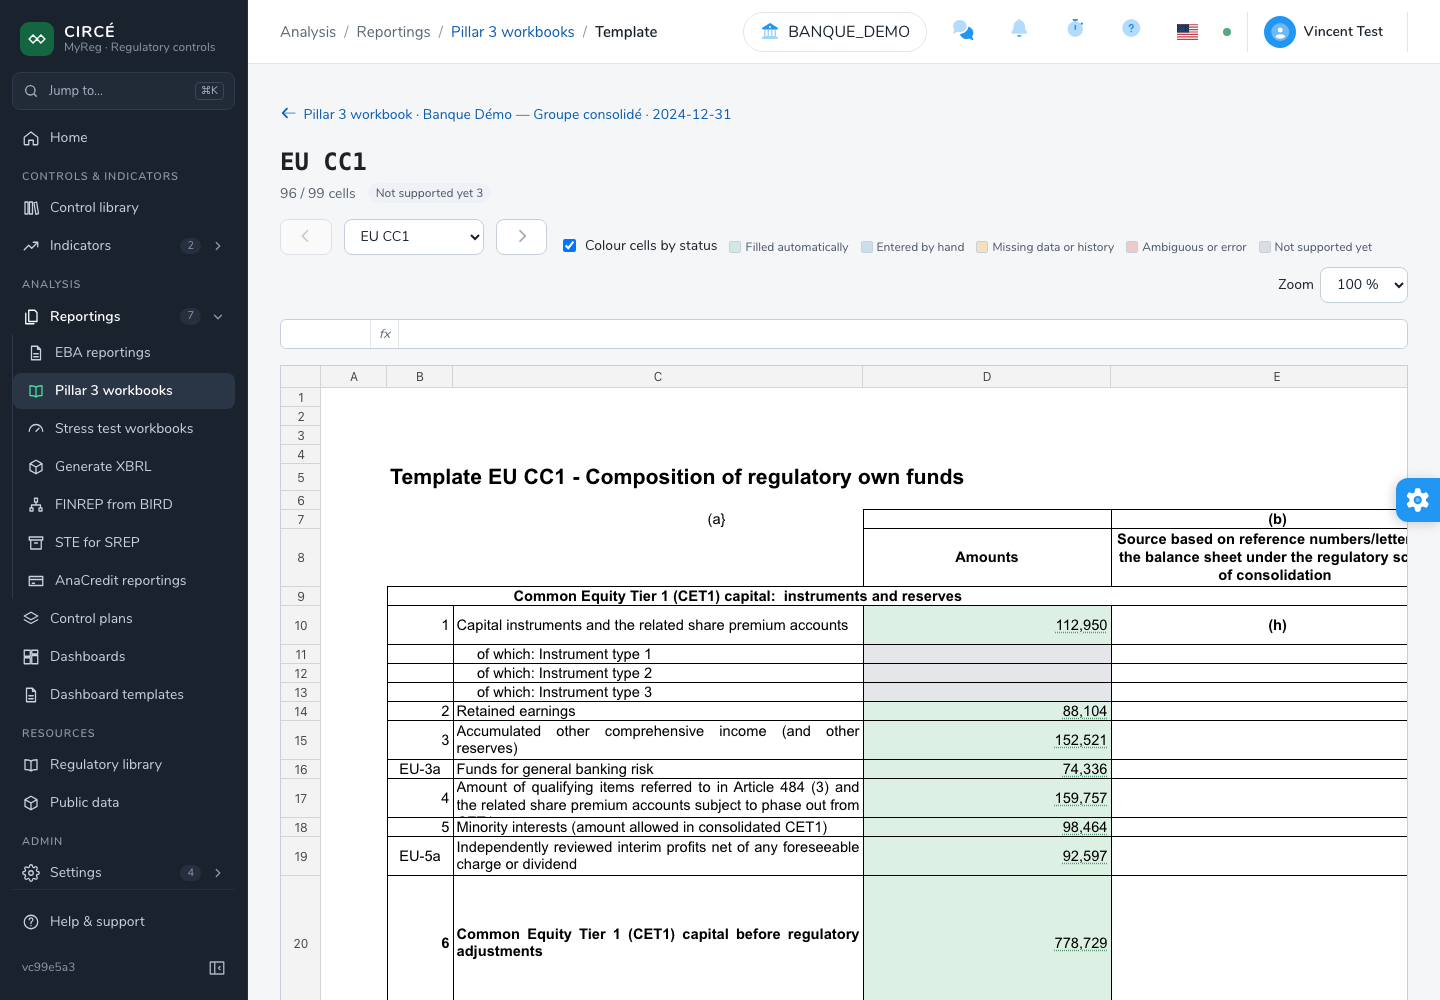
The sheet of a template is shown as it appears in Excel:
- Colour cells by status: filled automatically, entered by hand, missing data or history, ambiguous or error, not supported yet;
- a Selected cell bar, like Excel’s formula bar;
- each filled value is a link: click it to open the “How … is computed” dialog described above. The chosen cell is kept in the page address: reloading the page or sharing its link reopens the explain. A cell of another template, followed from this dialog, opens that template’s sheet on that cell;
- Previous template, Next template, a list of templates and a Zoom from 75 to 150 %.
Only templates are shown this way, not the review sheets.
The Reportings used tab
The tab lists the source reportings, with their Reporting date, a link to the Reporting, the Framework, the Release, the Module, the Entity, the Scope (consolidated or individual) and whether it was Used.
- A reporting deleted since the generation is marked Deleted.
- A reporting set aside is marked Not read.
- A warning icon on the tab means that some source files raised a diagnostic.
The Benchmark tab
This tab only appears with the Public data module. It contains:
- the EU KM1 peer comparison, if the workbook contains EU KM1: see Compare EU KM1 with peers;
- the EBA risk indicators: see EBA risk indicators.
Public data are only read when the tab is opened.
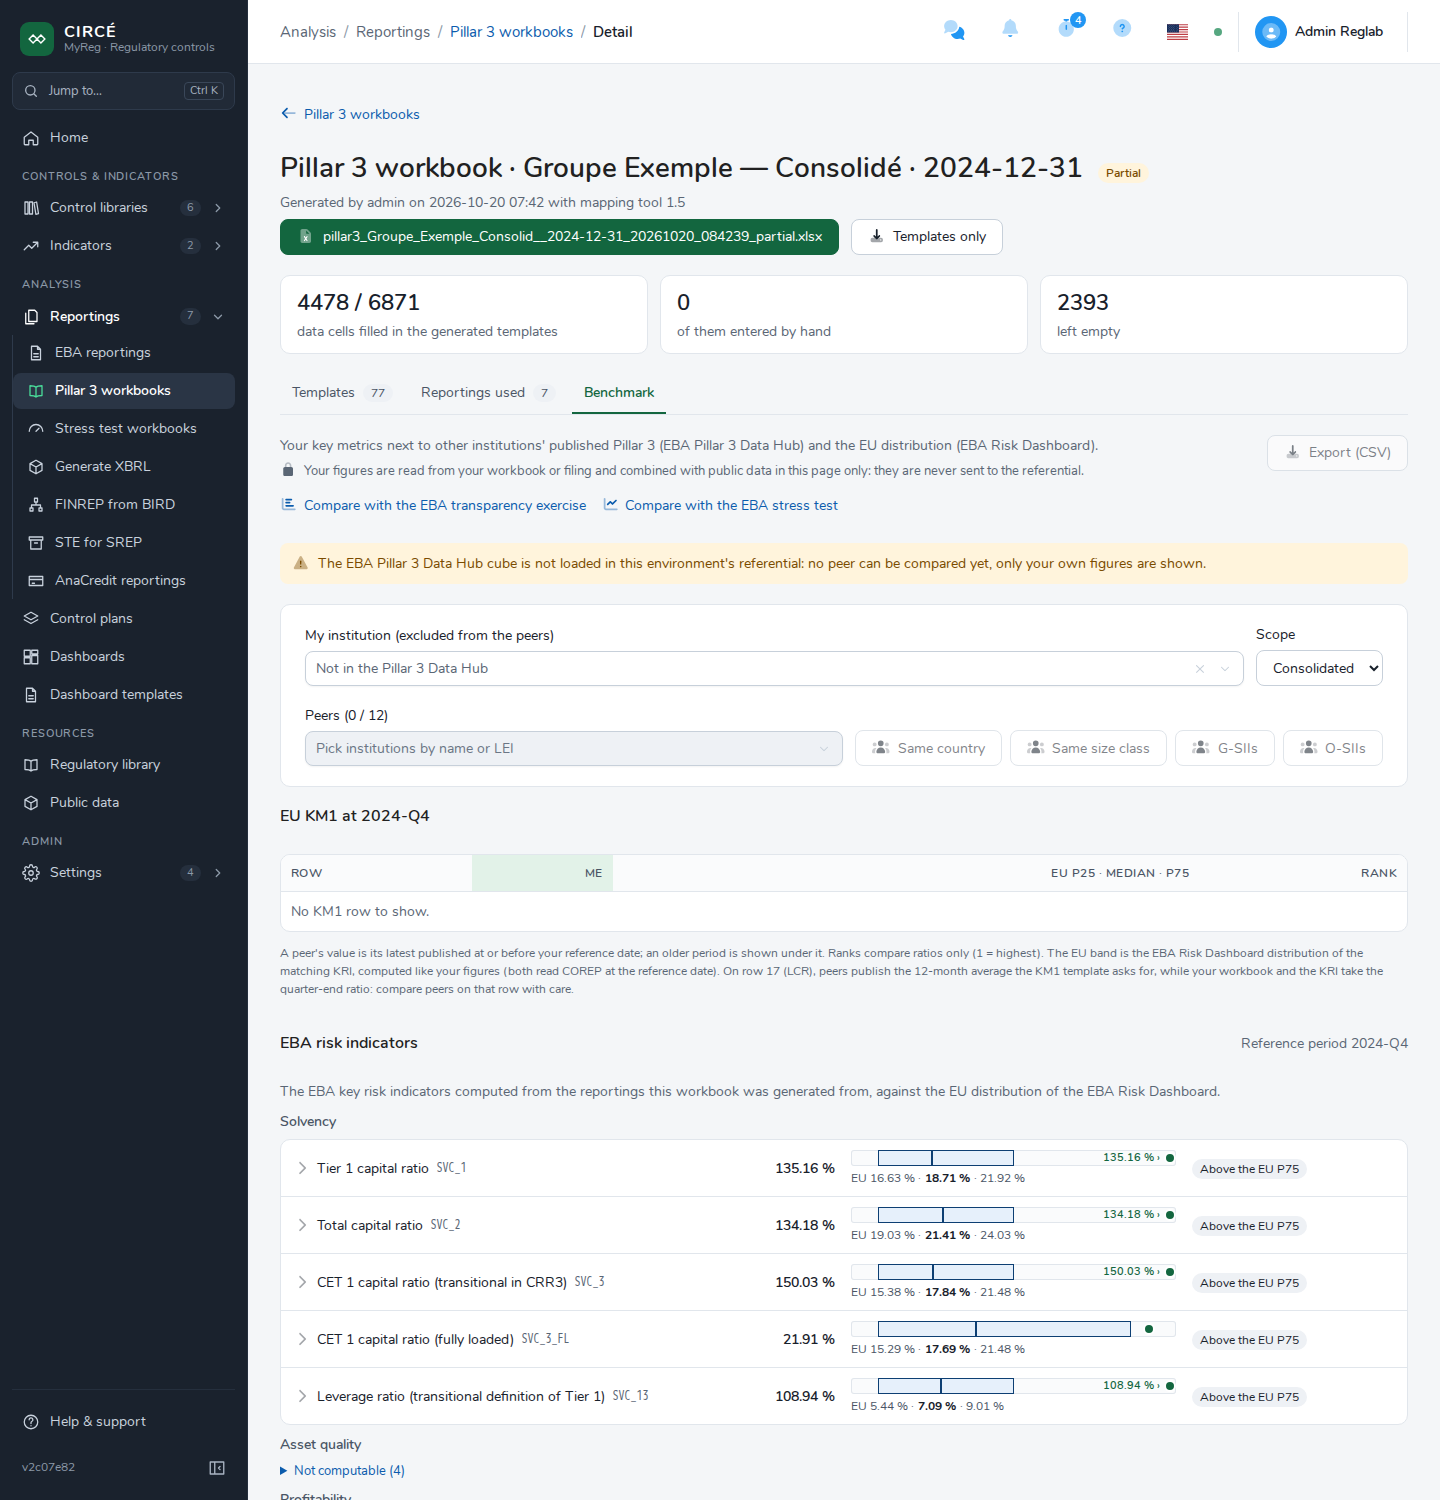
EBA risk indicators
For each workbook, the application computes 21 key risk indicators (KRIs) of the EBA Risk Dashboard from the reportings the workbook was generated from. It places them against the EU distribution published by the EBA.
The indicators are grouped by category: Solvency, Liquidity, Funding, Asset quality and Profitability. They are SVC_1, SVC_2, SVC_3, SVC_3_FL, SVC_13, LIQ_17, LIQ_20, FND_32, FND_33, AQT_3_1, AQT_3_2, AQT_41_2, AQT_42_2, PFT_21, PFT_23, PFT_24, PFT_25, PFT_26, PFT_29, PFT_41 and PFT_43.
For each indicator, the page shows:
- your value for the Reference period;
- the EU band: P25–P75 and median of the EU distribution, at or before your reference date. An older period is shown next to it;
- your position: Below the EU P25, Between the EU P25 and median, Between the EU median and P75, Above the EU P75;
- Show the facts the indicator is computed from: the Formula of the indicator, for example
A / B, and its EBA definition, then each term with its reference, date, value and file. A term read from a reported cell is a link that opens the template of the reporting, the cell highlighted (see Open a datapoint in its template).

Not computable indicators are listed separately, with their reason: a template read is missing, a fact is reported nil, reportings are needed at earlier dates, several facts match, a fact cannot be read, or the denominator is zero.
Calculation rules:
- KRIs are computed from their components, not from the ratios already reported (C 03.00, C 76.00).
- A blank line reads as 0.
- A year-to-date numerator is annualised (× 12 / number of months).
- PFT_21, PFT_24 and PFT_41 have a denominator averaged from the previous December to T. Missing dates are looked for in the perimeter’s reportings (same LEI and consolidation, official first). If some are still missing, the indicator is marked approximated and the missing date is named.
A position above or below the band is neither good nor bad in itself: it depends on the indicator.
If the EBA Risk Dashboard is not loaded in your installation’s public data, your indicators are shown without the EU band.
Peer comparisons
These pages need the Public data module. Your figures are read from your workbook or filing and combined with public data in the page only: they are never sent to the referential.
Compare EU KM1 with peers
The Compare EU KM1 with peers page opens from the Compare my EU KM1 with peers link of the Pillar 3 workbooks page, or from the Compare KM1 with peers entry of a workbook’s ⋯ menu. It compares your key metrics with other institutions’ published Pillar 3 (EBA Pillar 3 Data Hub) and with the EU distribution (EBA Risk Dashboard).
- My KM1: choose the source of your figures, among the Generated workbooks and the Imported Pillar 3 filings.
- My institution (excluded from the peers): choose your institution, and the Scope, Consolidated or Individual.
- Peers (n / 12): pick up to 12 institutions by name or LEI, or use Add peers: Same country, Same size class, G-SIIs, O-SIIs. These shortcuts require your institution to be chosen. Clear empties the list.
The EU KM1 at … table shows, row by row, your value (Me), each peer’s, the EU P25 · median · P75 band and your Rank (ratios only, 1 = highest). Clicking a row draws it in the chart. Export (CSV) downloads the table.
- A peer’s value is its latest published at or before your reference date; an older period is shown under it.
- On row 17 (LCR), peers publish the 12-month average the KM1 template asks for, while your workbook takes the quarter-end ratio: compare that row with care.
If the EBA Pillar 3 Data Hub cube is not loaded in your installation’s public data, no peer can be compared: only your own figures are shown.
From this page, two links open the following comparisons.
Compare with the EBA transparency exercise
The Compare capital and leverage with the EBA transparency exercise page places your KM1 capital and leverage next to the banks of the EBA EU-wide transparency exercise, quarter by quarter.
- The metrics are: CET1 ratio (transitional), CET1 ratio (fully loaded), Tier 1 ratio, Total capital ratio, Leverage ratio (transitional), CET1 capital, Total risk exposure amount and Leverage ratio total exposure measure.
- Peers are picked as for KM1, with the Same supervisor country and All banks of the exercise shortcuts.
- The My figures at … against the peers table gives the peers’ quartiles (P25, median, P75), computed without you, and your rank. The Each peer table details each bank’s values.
Amounts are in EUR million: your KM1 amounts are divided by 1,000,000 and assumed to be in euro. KM1 has no fully loaded CET1 ratio: that line shows the peers only.
Compare with the EBA stress test
The Compare capital ratios with the EBA stress test page places your latest KM1 ratio next to the starting points and the baseline and adverse projections of the banks in the EBA 2025 EU-wide stress test.
- The ratios are: CET1 ratio (transitional), CET1 ratio (fully loaded), Total capital ratio (transitional) and Leverage ratio (transitional).
- For each peer: the Starting point (end 2024, restated by the EBA), the Adverse low (the lowest adverse projection over 2025–2027) and the Adverse depletion (in percentage points).
- The My ratio is above line shows how many peers have a starting point, then an adverse low, below your ratio.
- Two charts show each peer’s starting point and adverse low, and the Paths, 2024 to 2027 (baseline and adverse, with the peers’ medians). Click a bank to draw its paths.
Your institution has no stress test of its own: your ratio is your latest KM1 figure, unstressed.
Treatments
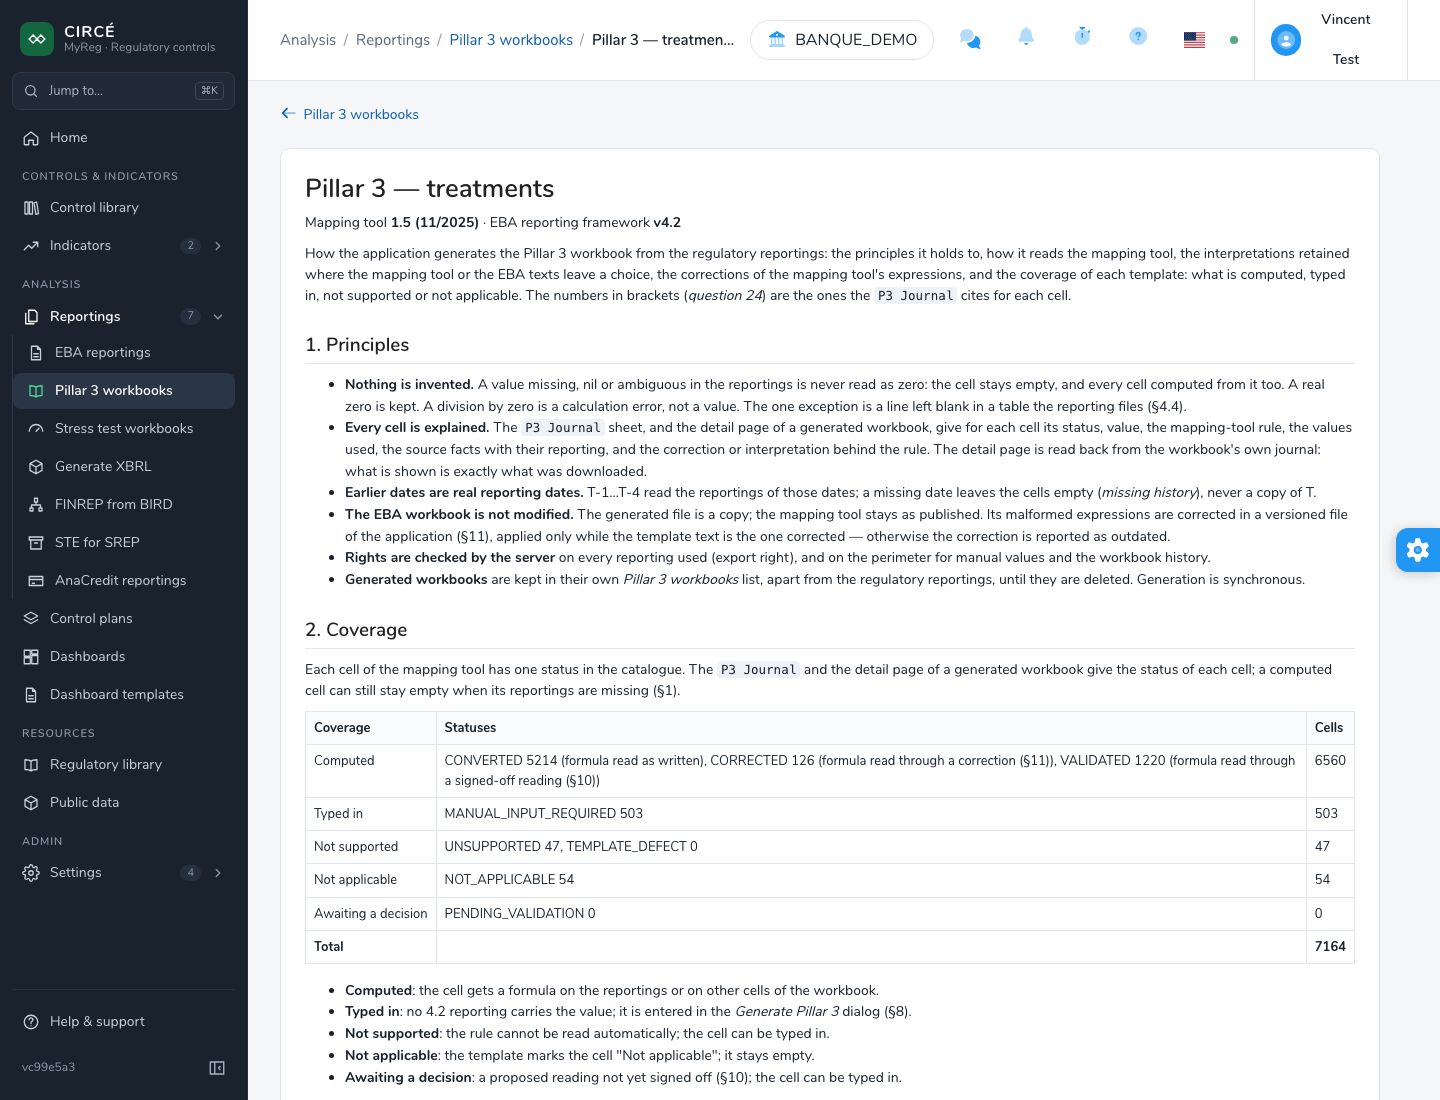
The Treatments behind the workbook link of the Pillar 3 workbooks page opens the Pillar 3 — treatments page. It gives the version of the mapping tool and of the EBA reporting framework, then describes how the application generates the workbook from the reportings:
- Principles: nothing is invented, every cell is explained, earlier dates are real reporting dates, the EBA workbook is not modified.
- Coverage: the status of each cell of the catalogue, by template, with the cells entered by hand and the cells not supported.
- Reportings used.
- Reading the mapping tool: references, variants and totals, row filters, rows left blank, references to other cells of the workbook, periods and averages.
- Choices of the institution (see Disclosure choices).
- Interpretations by template.
- Securitisation: EU SEC1, SEC3, SEC4 and SEC5.
- Cells the mapping tool leaves without a mapping: FRTB tables, manual values, not automated.
- Z-axis labels and DPM 1.0 members matched with DPM 2.0 members.
- Validated readings.
- Corrections of the mapping tool.
The numbers in brackets, for example “(question 24)”, are those the P3 Journal sheet cites for each cell.
Some readings are ready but stay inactive until they are validated (Awaiting validation status). Workbooks only change after their validation.
The rule language
The formulas shown by Show formulas and in the journal are those of the Pillar 3 catalogue. Besides cell references, they use the following functions. This language is distinct from the control grammar.
| Function | Role |
|---|---|
monthly_average(expr, n) |
Average of expr over the n month ends up to the cell’s date. It is the average of the ratios, not the ratio of the averages. All observations are required. |
quarterly_median(expr, n) |
Median over n quarter ends. With an even number of observations, interpolation between the two middle values. |
sum_rows(measure, condition, …) |
Sum of a column over the rows of an open table that meet all the conditions. Operators: =, !=, in ("…", …), is empty, <, <=, >, >=. Table not reported: missing data; table reported with no matching row: 0. On a text column: the distinct texts, separated by “;”. |
sum_keys({table, row, column}) |
Total of a cell over all the members of an open axis, for instance all the countries of C 09.04. Only used by rules awaiting validation. |
if(condition, then, else), and(c1, c2, …), x is reported, x is empty |
Conditions. Only used by rules awaiting validation. |
The status of a catalogue rule is one of: Automated, Automated (validated interpretation), Automated (corrected formula), Awaiting validation, Not applicable, Manual input, Malformed formula, Not supported yet.
EBA indicators and the Risk Dashboard
Two sets of EBA indicators coexist in the application:
- the Pillar 3 workbook KRIs described above: 21 EBA Risk Dashboard indicators, computed automatically for each workbook and compared with the EU distribution. They cannot be edited;
- the EBA indicators you import into your indicators: the full list, to track over time with your dashboards.